
Field Notes
<--2023-08-23 11:30:00 | 2023-09-12 12:05:00-->Other sites visited today: Bouldin Alfalfa | Gilbert Tract
Phenocam link: Searching...
Mayberry: 2023-09-06 11:20:00 (DOY 249)
Author: Daphne Szutu
Others: Kyle
Summary: Regular data collection/cleaning, collected sediment bubble samples, porewater samples, shadowband not spinning--fixed
| 2023-09-06 Mayberry Kyle and I arrived around 11:20 PDT. It was breezy, sunny, and mild. The wetland still looks pretty green and the water level has come back up. We saw a handful of caterpillars on the cattail around the tower, but it might be too late in the season for them to make a big dent in this year’s carbon capture.The staff gauge read 33cm. We got started with sampling bubbles from the sediment. We took 12 gas samples in four locations among the cattails within 15m of the tower. The first location was adjacent to the tower to the east, the second location was adjacent to the tower to the west, the third location was about 10-15m west of the tower along the channel, and the fourth location was about 5m east of the tower. Kyle also took a sediment sample at each location. The soil was very soft and mushy along the edge of the channel, but the matted plant roots among the cattails made the soil much firmer, so it was hard in some locations to poke the soil and collect enough bubbles. Kyle wanted to get 90ml of gas for each sample, but some samples only had 60-75ml of gas. We started the regular tower work around 13:00 PDT, and the 7700 happened to wash itself at that time. I downloaded met, cam, and USB GHG data. The rotating shadowband was not moving, and no diffuse PAR data since yesterday. I checked the screw terminal in the motor enclosure and tightened everything (the black power wire to the motor was tightened 1 turn). I didn’t see any corrosion in the screw terminal like I saw earlier at GT. The motor started working again after tightening the screws, and I’ll keep an eye on it. I measured the resistance across the dfPAR resistor. It’s a small square black resistor and it read 887ohms. I was expecting something closer to 1000 ohms. Kyle cleaned flux and rad sensors and reported that the 7700 bottom mirror was dusty. The reservoir was 90% full; I topped it off. Kyle sampled water from the porewater sippers and measured their conductivity. She used a smaller syringe (50ml?) and attached a softer tubing between the syringe and the harder tubing of the sipper. The softer tubing can be pinched or folded to maintain pressure inside the sipper. She used a different syringe for each sipper and poured the sample into a new plastic vial to measure. Veg-black-bare, 15.3mS, 25.8C Veg-black-green, 10.48mS, 26.7C Veg-black-red, 13.4mS, 27.3C Surface, 2.5mS, 24.7C The 7500 read: 400ppm CO2, 693 mmol/m3 H2O, 23.6C, 100.6kPa, 89SS – 100 after cleaning The 7700 read: 1.98ppm CH4, 51RSSI – 73 after cleaning. We left at 14:05 PDT. We came back briefly at 14:20 PDT so Kyle could sample and measure the surface water for conductivity. We left again at 14:25 PDT. |
3 photos found

20230906MB_KyleBubbles.jpg ( 2023-09-06 11:45:56 ) Full size: 1440x1920
Kyle collecting sediment gas samples using a plastic tub
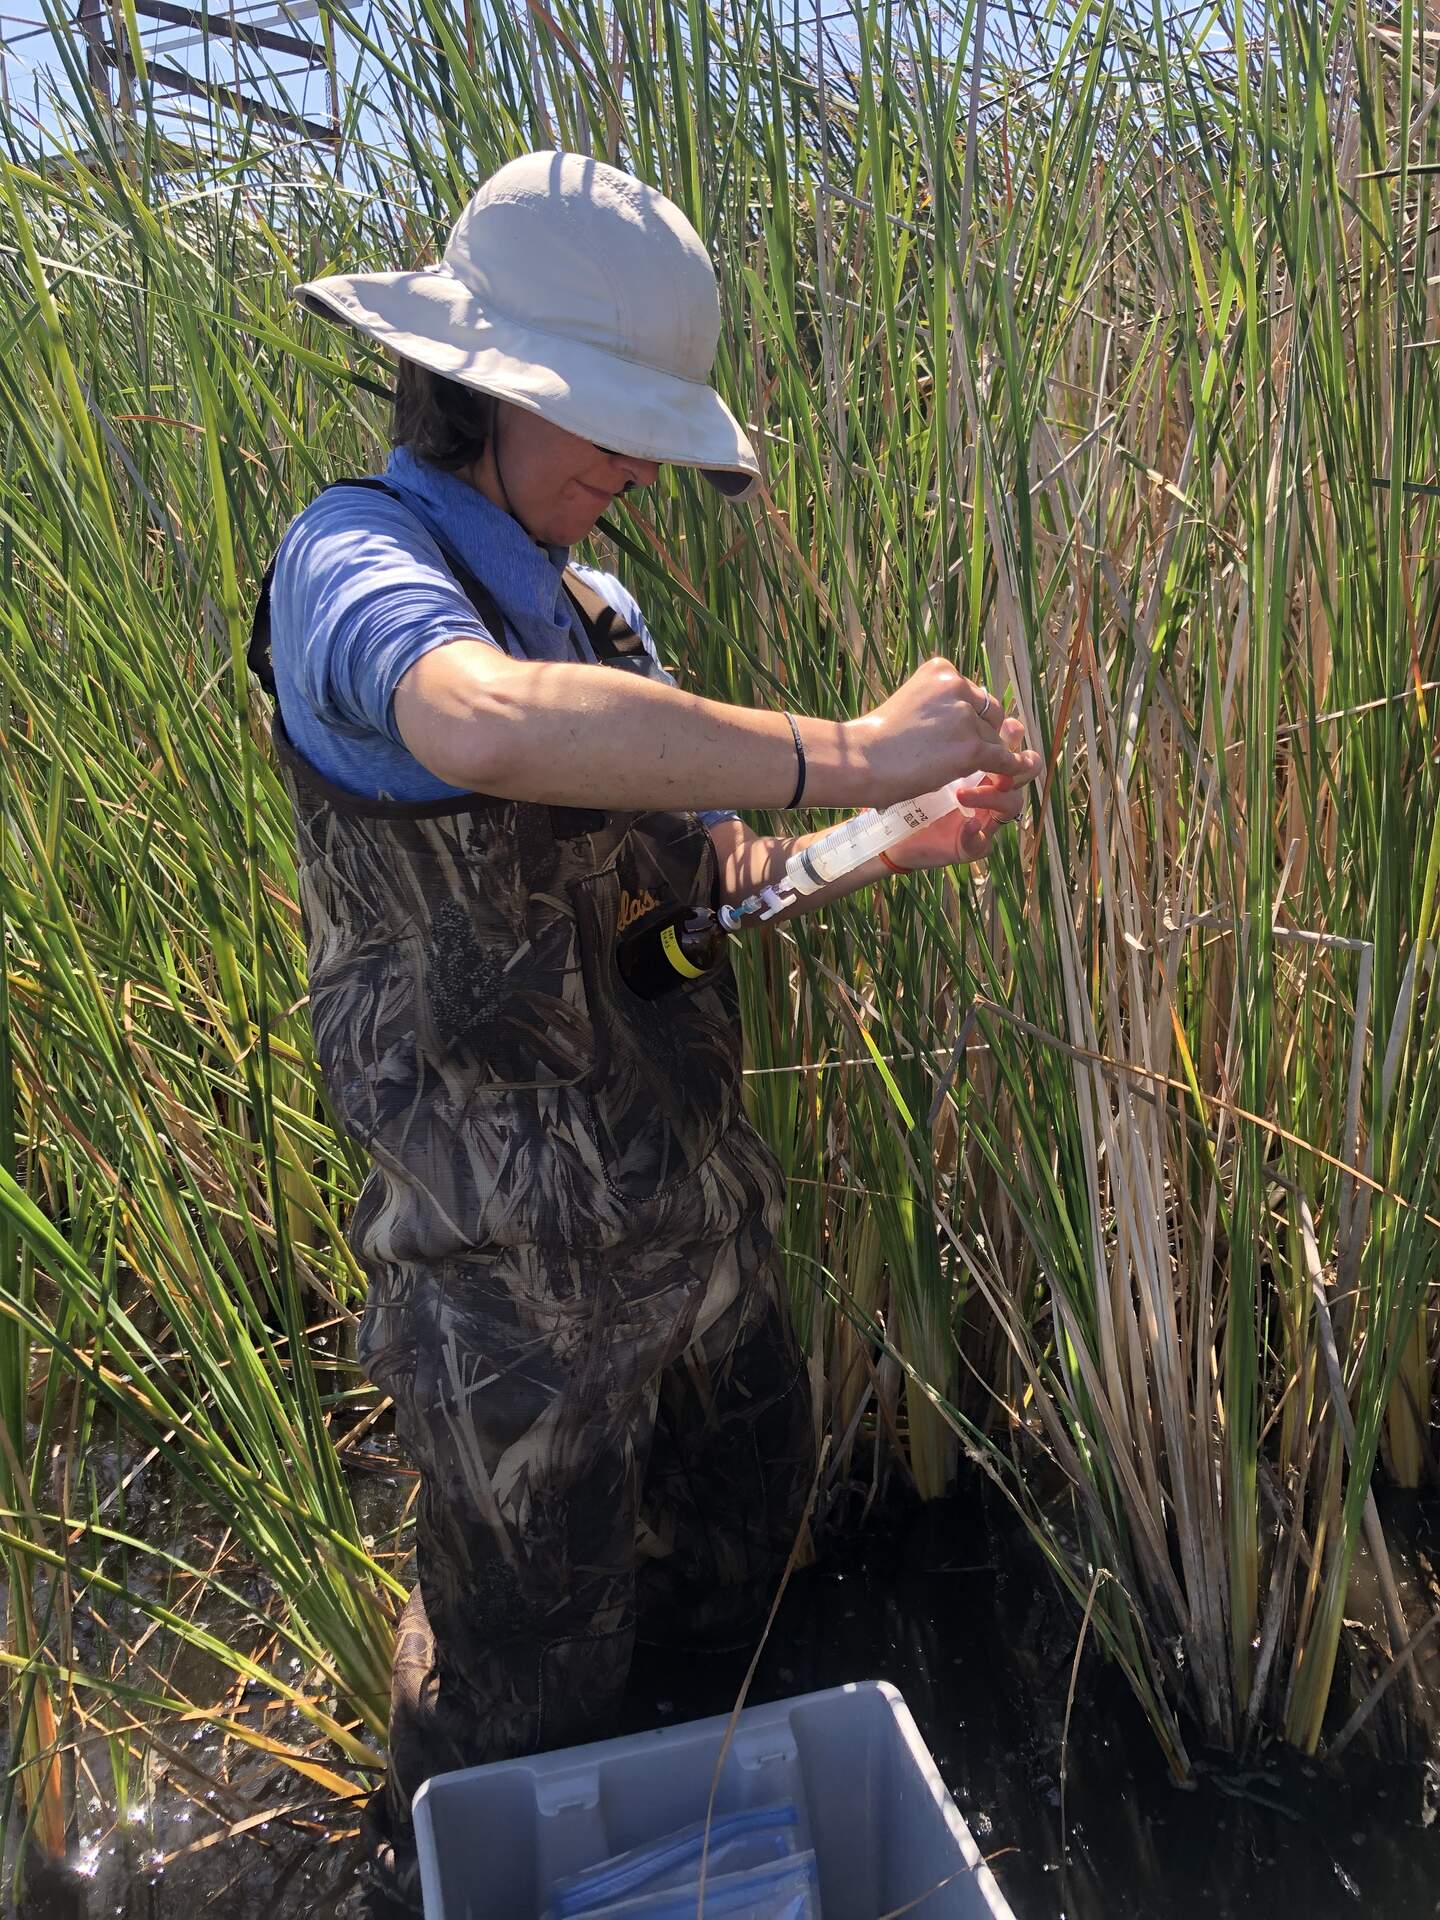
20230906MB_KyleCattails.jpg ( 2023-09-06 12:27:24 ) Full size: 1440x1920
Kyle injecting methane gas samples into a sample bottle

20230906MB_KyleSyringe.jpg ( 2023-09-06 12:18:43 ) Full size: 1440x1920
Kyle injecting methane gas samples into a sample bottle
11 sets found
7 MB_flux graphs found
No data found for MB_met.
28 MB_tule graphs found
Can't check MBWPEESWGT_mixed
1 MB_cam graphs found
Can't check MBEEWPSWEPGT_cam
Can't check SIMBTWEE_met
1 MB_minidot graphs found
Can't check MBSWEEWPBCBA
1 MB_processed graphs found
Can't check MB_fd
1 MB_fd graphs found