Field Notes
<--2023-08-08 14:10:00 | 2023-09-12 14:10:00-->Other sites visited today: Gilbert Tract | Mayberry | West Pond
Phenocam link: Searching...
East End: 2023-08-23 14:40:00 (DOY 235)
Author: Joe Verfaillie
Others: Daphne
Summary: Standard data collection, super hot, super tall and lush vegetation, fixed tilted NDVI sensors, need new sonic spikes
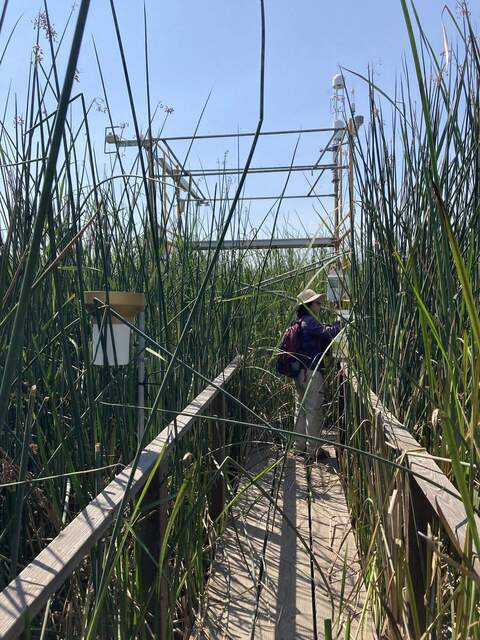
| East End 2023-08-23 Daphne and I arrived at about 14:40 PDT. It was hot and muggy with no breeze and wasps everywhere - “stupid hot”. The tules here seem taller than I have ever seen them. Even though we added an extra 3ft of height to the solar panels, they are still just peeking out of the tules. I cut a bunch down around the tipping bucket and along the boardwalk. The water level is high but we forgot to write it down - see stupid hot. We are testing our new Licor LI-7810 (CO2/CH4/H2O) analyzer and LI-8100 Smart Chamber. We forgot one of the batteries today so have been running all day on half the normal power. We set up for measurements here but the analyzer ran out of power. We collected the data and swapped the desiccant in the MiniDot and water level cable. The 7500 read: 412ppm CO2, 810mmol/m3 H2O, 38.4C, 100.9kPa, 100SS – 102 after cleaning The 7700 read: 2.12ppm CH4, 32RSSI – 82 after cleaning The sonic is missing two of its three bird spike strips. The 7700 spray head was not seated flush – fixed. The wash reservoir was 90% full – topped off. The NDVI sensors were tilted at about 30 degrees from level. I straightened them and tightened the hose clamp. We left at 15:30 PDT |
1 photos found

20230823EE_TallTules.jpg ( 2023-08-23 14:44:50 ) Full size: 1440x1920
The tules and cattails at all the wetlands seem tall and lush this year
11 sets found
14 EE_met graphs found
Can't check EE_mixed
1 EE_mixed graphs found
8 EE_flux graphs found
Can't check MBWPEESWGT_mixed
1 EE_cam graphs found
Can't check MBEEWPSWEPGT_cam
Can't check SIMBTWEE_met
Can't check EE_Temp
5 EE_Temp graphs found
Can't check EE_minidot
1 EE_minidot graphs found
Can't check MBSWEEWPBCBA
1 EE_processed graphs found

