Field Notes
<--2023-02-14 14:00:00 | 2023-03-17 13:10:00-->Other sites visited today: Hill Slough | Bouldin Corn | Bouldin Alfalfa | East End | Mayberry | Gilbert Tract
Phenocam link: Searching...
West Pond: 2023-03-02 13:35:00 (DOY 61)
Author: Daphne Szutu
Others: Kyle
Summary: Regular data collection/cleaning, lots of water in the wetland
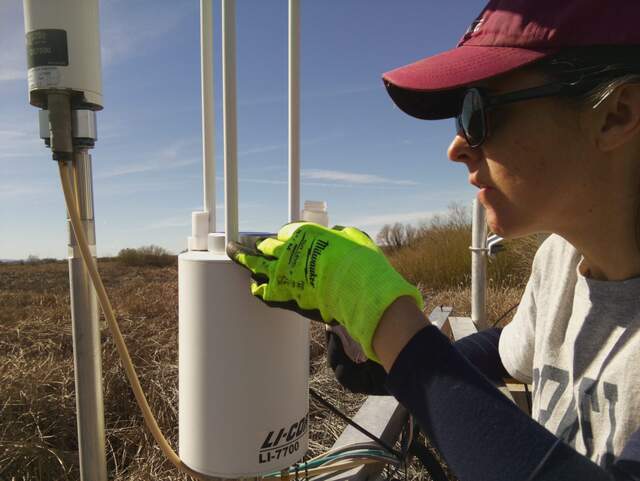
| 2023-03-02 West Pond Kyle and I arrived at 13:35 PST. It was cool, sunny, and mostly calm. We cleared a large tree branch that was blocking the levee road, about halfway between the inlet and the shipping container. We got about 5cm of rain last week, and more rain is coming at the end of next week. There is lots of water in this wetland! The staff gauge read 90cm. The plank pathway from the road to the scaffolding was just above the water. I downloaded met, cam, USB GHG, and miniDOT data. Kyle cleaned flux and rad sensors. I topped off the wash reservoir and swapped desiccants for the miniDOT and water level sensors. The 7500 read: 429ppm CO2, 252mmol/m3 H2O, 15.3C, 101.9kPa, 108SS--108 after cleaning The 7700 read: 2.0ppm CH4, 50RSSI--73 after cleaning We left around 14:00 PST. |
1 photos found

WP_picam_20230302_1345.jpg ( 2023-03-02 13:45:06 ) Full size: 1917x1440
Kyle cleaning LI7700
8 sets found
Can't check WP_DO
1 WP_DO graphs found
14 WP_met graphs found
5 WP_flux graphs found
Can't check MBWPEESWGT_mixed
Can't check MBEEWPSWEPGT_cam
Can't check MBSWEEWPBCBA
1 WP_processed graphs found
4 WP_arable graphs found

