Field Notes

<--2025-03-11 10:05:00 |
Other sites visited today: Tonzi
Phenocam link: Searching...

Vaira: 2025-03-27 12:40:00 (DOY 86)
Author: Joe Verfaillie
Others: Kuno

Summary: Standard fieldwork, went to the pond. Trees mostly leafed out. No spectra because I forgot the Jaz.

Vaira
2025-03-27

Kuno and I arrived at about 13:40. It had been cool with a dark overcast and a little spit of rain but was partly sunny when we got here. The trees are mostly leafed out. The grass is still short due to grazing. I forgot the spectrometer today. Two cow rancher trucks went out while I was at the tower.

I did the standard data collection at the tower: flux, met, camera and FD data.
The 7500 read: 422.8ppm CO2, 552.8mmol/m3 H2O, 19.5C, 99.6kPa, 99.7SS

All seemed well.

Kuno did the well measurement and we went to the pond.

We left at about 14:30

Field Data

No tank data

No VR Well data found

No TZ Moisture Point data found

No VR Moisture Point data found

No TZ grass heigth found

No VR grass heigth found

No VR Tree DBH found

No water potential data found

No VR Grass Biomass data found

No VR OakLeaves Biomass data found

No VR PineNeedles Biomass data found

1 photos found

Green grass and trees, blue sky and white clouds
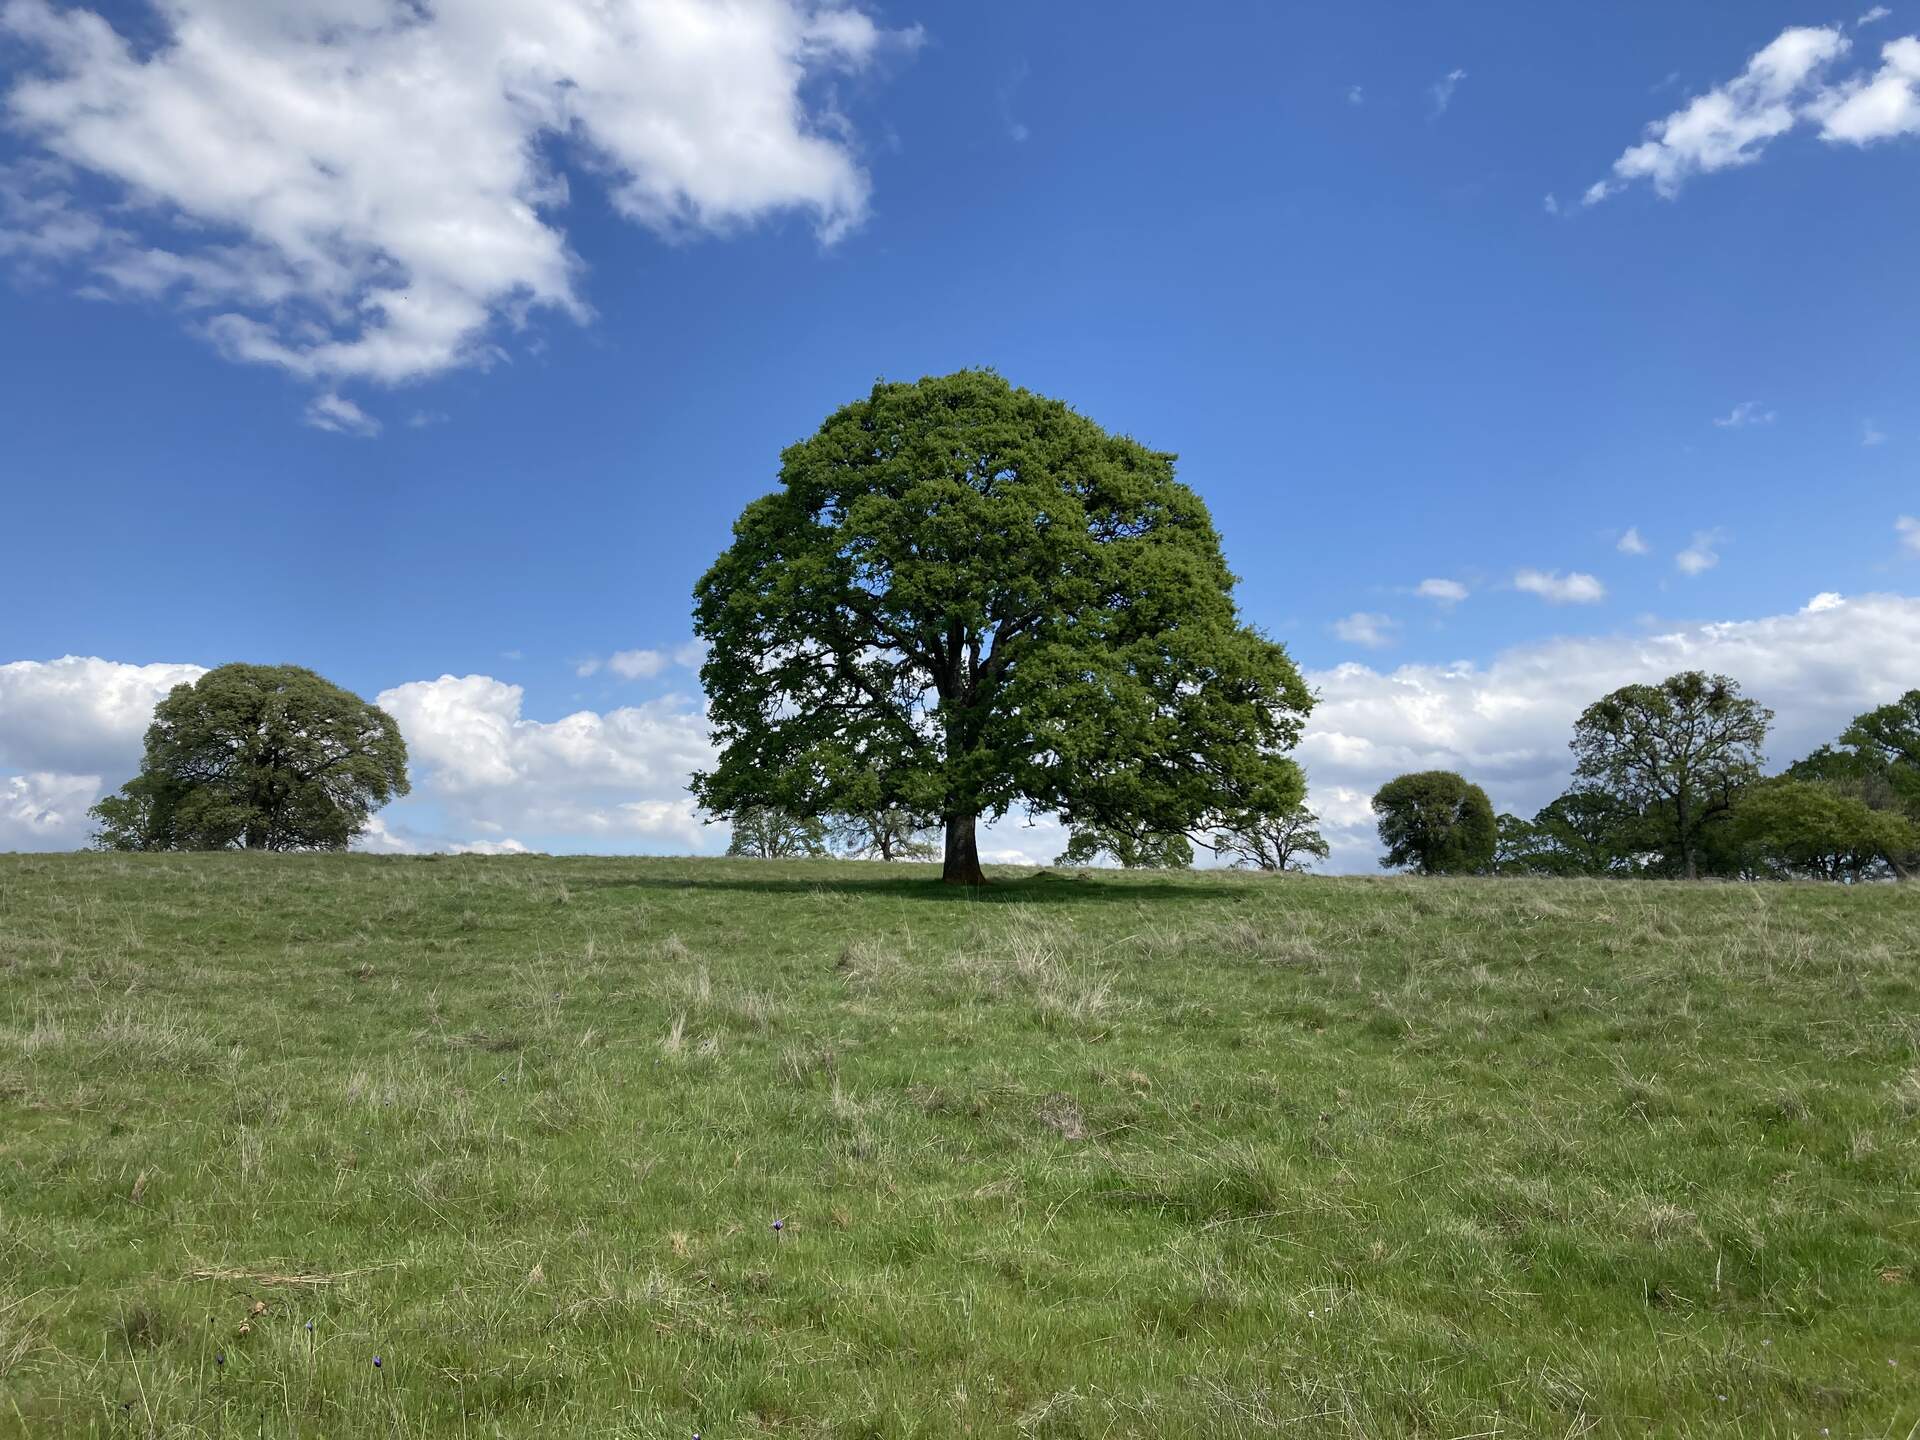
20250327VR_IconicTree.jpg ( 2025-03-27 13:37:02 ) Full size: 1920x1440
Green grass and trees, blue sky and white clouds

Graphs display:
9 sets found

16 VR_met graphs found

Explore the graph:Temperatures in a new window

Explore the graph:System Power Voltage in a new window

Explore the graph:Soil Temperatures Set 1 in a new window

Explore the graph:Soil Temperatures Set 2 in a new window

Explore the graph:Soil Temperature Set 3 in a new window

Explore the graph:Soil Temperature at -4cm in a new window

Explore the graph:Soil Heat Flux in a new window

Explore the graph:Soil Moisture in a new window

Explore the graph:Photosynthetic Active Radiation in a new window

Explore the graph:Short/Long Wave Radiation in a new window

Explore the graph:LED sensor in a new window

Explore the graph:Vaira PPT in a new window

Explore the graph:Peltier SHF Plates in a new window

Explore the graph:Peltier SHF Temperatures in a new window

Explore the graph:LED NDVI in a new window

Explore the graph:NDVI SRS Raw Data in a new window

2 VR_flux graphs found

Explore the graph:CO2 Density in a new window

Explore the graph:Sonic Wind in a new window

No data found for VR_soilco2.
2 VR_pond graphs found

Explore the graph:Pond Level and Rain in a new window

Explore the graph:Vaira Pond Temperatures in a new window

Can't check TZVR_mixed
3 VR_fd graphs found

Explore the graph:Varia Forced Diffusion Soil CO2 Flux in a new window

Explore the graph:Vaira Forced Diffusion CO2 Concentration in a new window

Explore the graph:VR Forced Diffusion Temperature in a new window

No data found for VR_processed.
4 VR_arable graphs found

Explore the graph:Incoming bands in a new window

Explore the graph:Reflected Bands in a new window

Explore the graph:Solar Radiation in a new window

Explore the graph:Pressure and RH in a new window

6 VR_soilvue graphs found

Explore the graph:VR SoilVUE Profile B VWC in a new window

Explore the graph:VR SoilVue B Temperature in a new window

Explore the graph:VR SoilVue A Temperature in a new window

Explore the graph:VR SoilVue C Temperature in a new window

Explore the graph:VR SoilVUE Profile A VWC in a new window

Explore the graph:VR SoilVUE Profile C VWC in a new window