
Field Notes
<--2025-03-11 10:45:00 | 2025-04-10 10:00:00-->Other sites visited today: Vaira
Phenocam link: Searching...
Tonzi: 2025-03-27 08:00:00 (DOY 86)
Author: Joe Verfaillie
Others: Kuno, Housen
Summary: Standard field work, mostly leafed out, first midday water potential of the year, Housen installed GPS units, Theta probe 7 needs to be dug up.
| Tonzi 2025-03-27 Kuno and I arrived at about 9:00 PDT. Housen arrived a little later. It was supper dark with a low overcast. There was a little spit of rain at midday but not enough to really get anything wet. There were periods of sun breaking through too and a breeze from the southeast. The trees are largely leafed out but can range from no leaves to nearly full leaves. There's a scattering of flowers on the ground. We had a couple warm days but now are due for more colder wetter weather. There was a slight smell of wet fire when we arrived. Housen is here to setup three GPS receivers to record GPS signal-to-noise ratios from the tower top and at two places under the canopy. The idea is that you can get a map of canopy moisture with this data. I had to patch in some 12V lines for the GPS units but it should be super low power. One unit went on the railing on top of the tower getting power from the RH/T fan. One to the south near zcam1 with wire mesh fence added to protect it from cows. This one gets power from the zcam line - had to drill a new hold in the box. And the third went near zcam2 at the Floor location getting power from a strip in the box on the tower. We need a local wifi router to communicate with the units. I should get some data collection instructions next time out. Kuno did his usual rounds of trunk, soil and twig CO2/CH4 fluxes - sinks and sources are still strong even with the cold and dark weather. He also used the Lidar on his iPhone to make a map of the Floor trees. I collected the tower top flux, and camera data. The wash reservoir was about a quarter low - topped off. The 7500 read: 458.8ppm CO2, 552.2mmol/m3 H2O, 13.5C, 99.0kPa, 100.7SS The 7700 read: 2.10ppm CH4, 48.3RSSI - 82.7 after cleaning I collected the Floor flux and well data and the tree bole temps. All seemed well. The wash reservoir was a little low - I topped it off. There was a fine dust on the 7700 mirror like pollen or soot but didn't seem to hurt the RSSI too much. The 7500 read: 427.9ppm CO2, 522.8mmol/m3 H2O, 14.7C, 99.2kPa, 101.1SS The 7700 read: 2.06ppm CH4, 40.8RSSI - 85.5 after cleaning I did the manual well, soil moisture and dendrometer readings. I collected the FD data. Cows seemed to have chewed on tree 72 dendrometer band and I had to reset the gauge. The lower IRT was pushed to the side a bit - I put it back in its usual place. It might have been windy - a couple of the HISE point dendrometers solar panels were dangling - righted. I did midday water potential. Tree 102 had almost no leaves yet but a twig with buds had the same pressure as other nearby trees and the big tree that had baby leaves on their twigs. Readings were 10-15bar. Theta 7 is reading too low. I didn't see any problems with the wiring. This one is not in conduit and will take some work to dig up - it's supposedly at -50cm. Need to do a soil moisture overhaul. The fence charger at the Floor site initial reads full but quickly dies. I'm not sure why. It's getting 24V power from the Floor system. Maybe it needs a battery. I left the USB with the Tower met data in the USB hub at the tower, but I was able to use remote desktop to get the files from the lab. We left at about 13:30 PDT. |
Field Data
No tank data
No TZ Well data found
No TZ Moisture Point data found
No VR Moisture Point data found
No TZ grass heigth found
No VR grass heigth found
No TZ Tree DBH found
No water potential data found
No TZ Grass Biomass data found
No TZ OakLeaves Biomass data found
No TZ PineNeedles Biomass data found
4 photos found
20250327TZ_FloorPhoneLidar.jpg ( 2025-03-27 00:00:00 ) Full size: 477x358
Lidar map of the Floor stand made with Kuno's iPhone
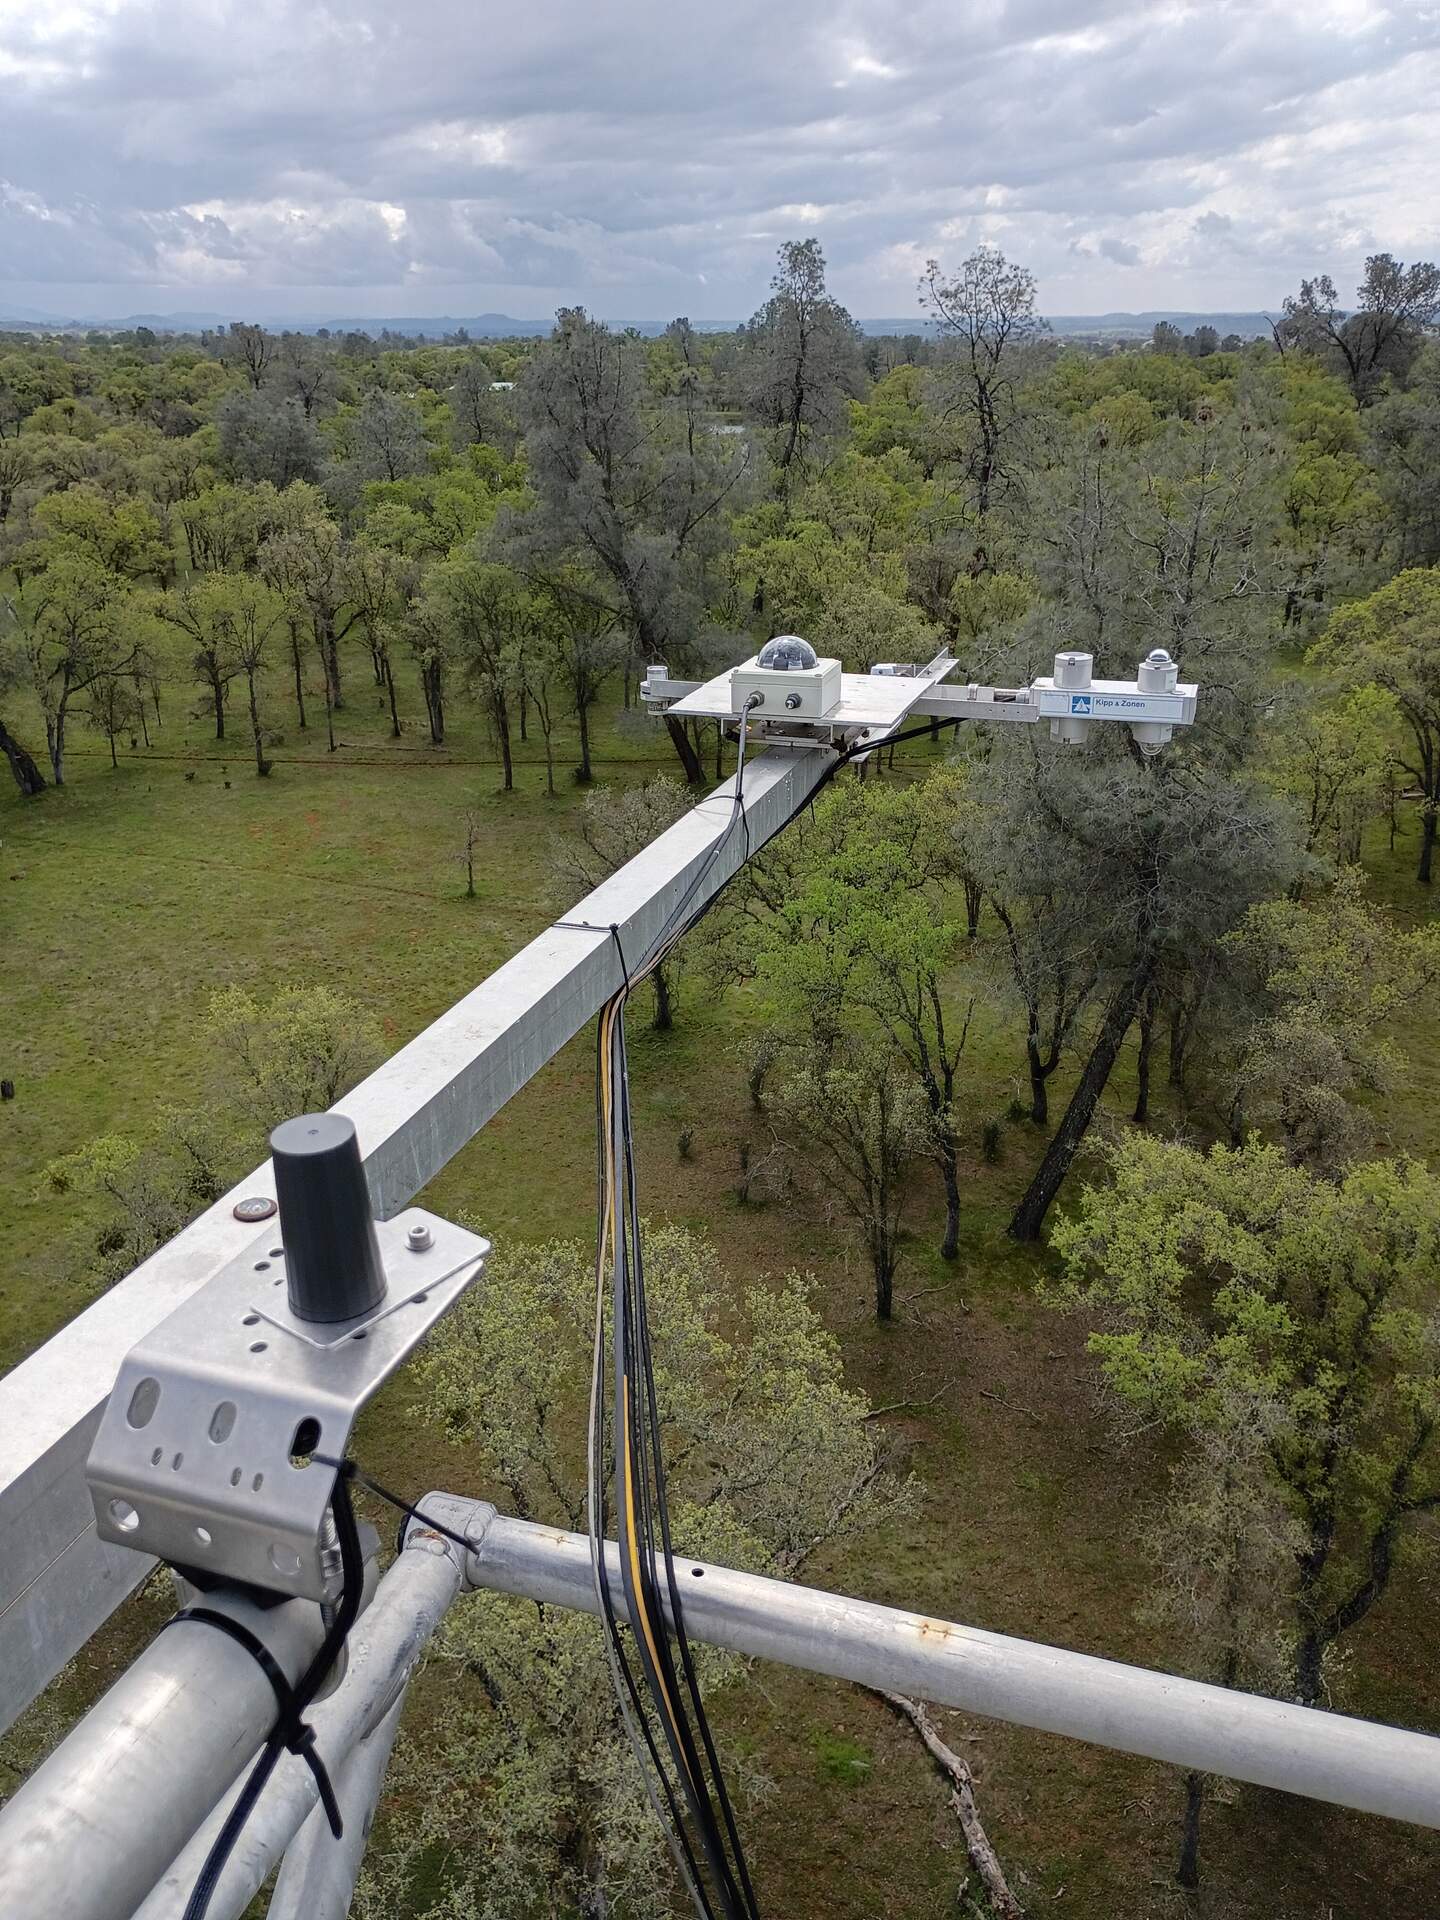
20250327TZ_HousenTowerGPS.jpg ( 2025-03-27 12:38:53 ) Full size: 1440x1920
Housen's GPS unit on the Tower top
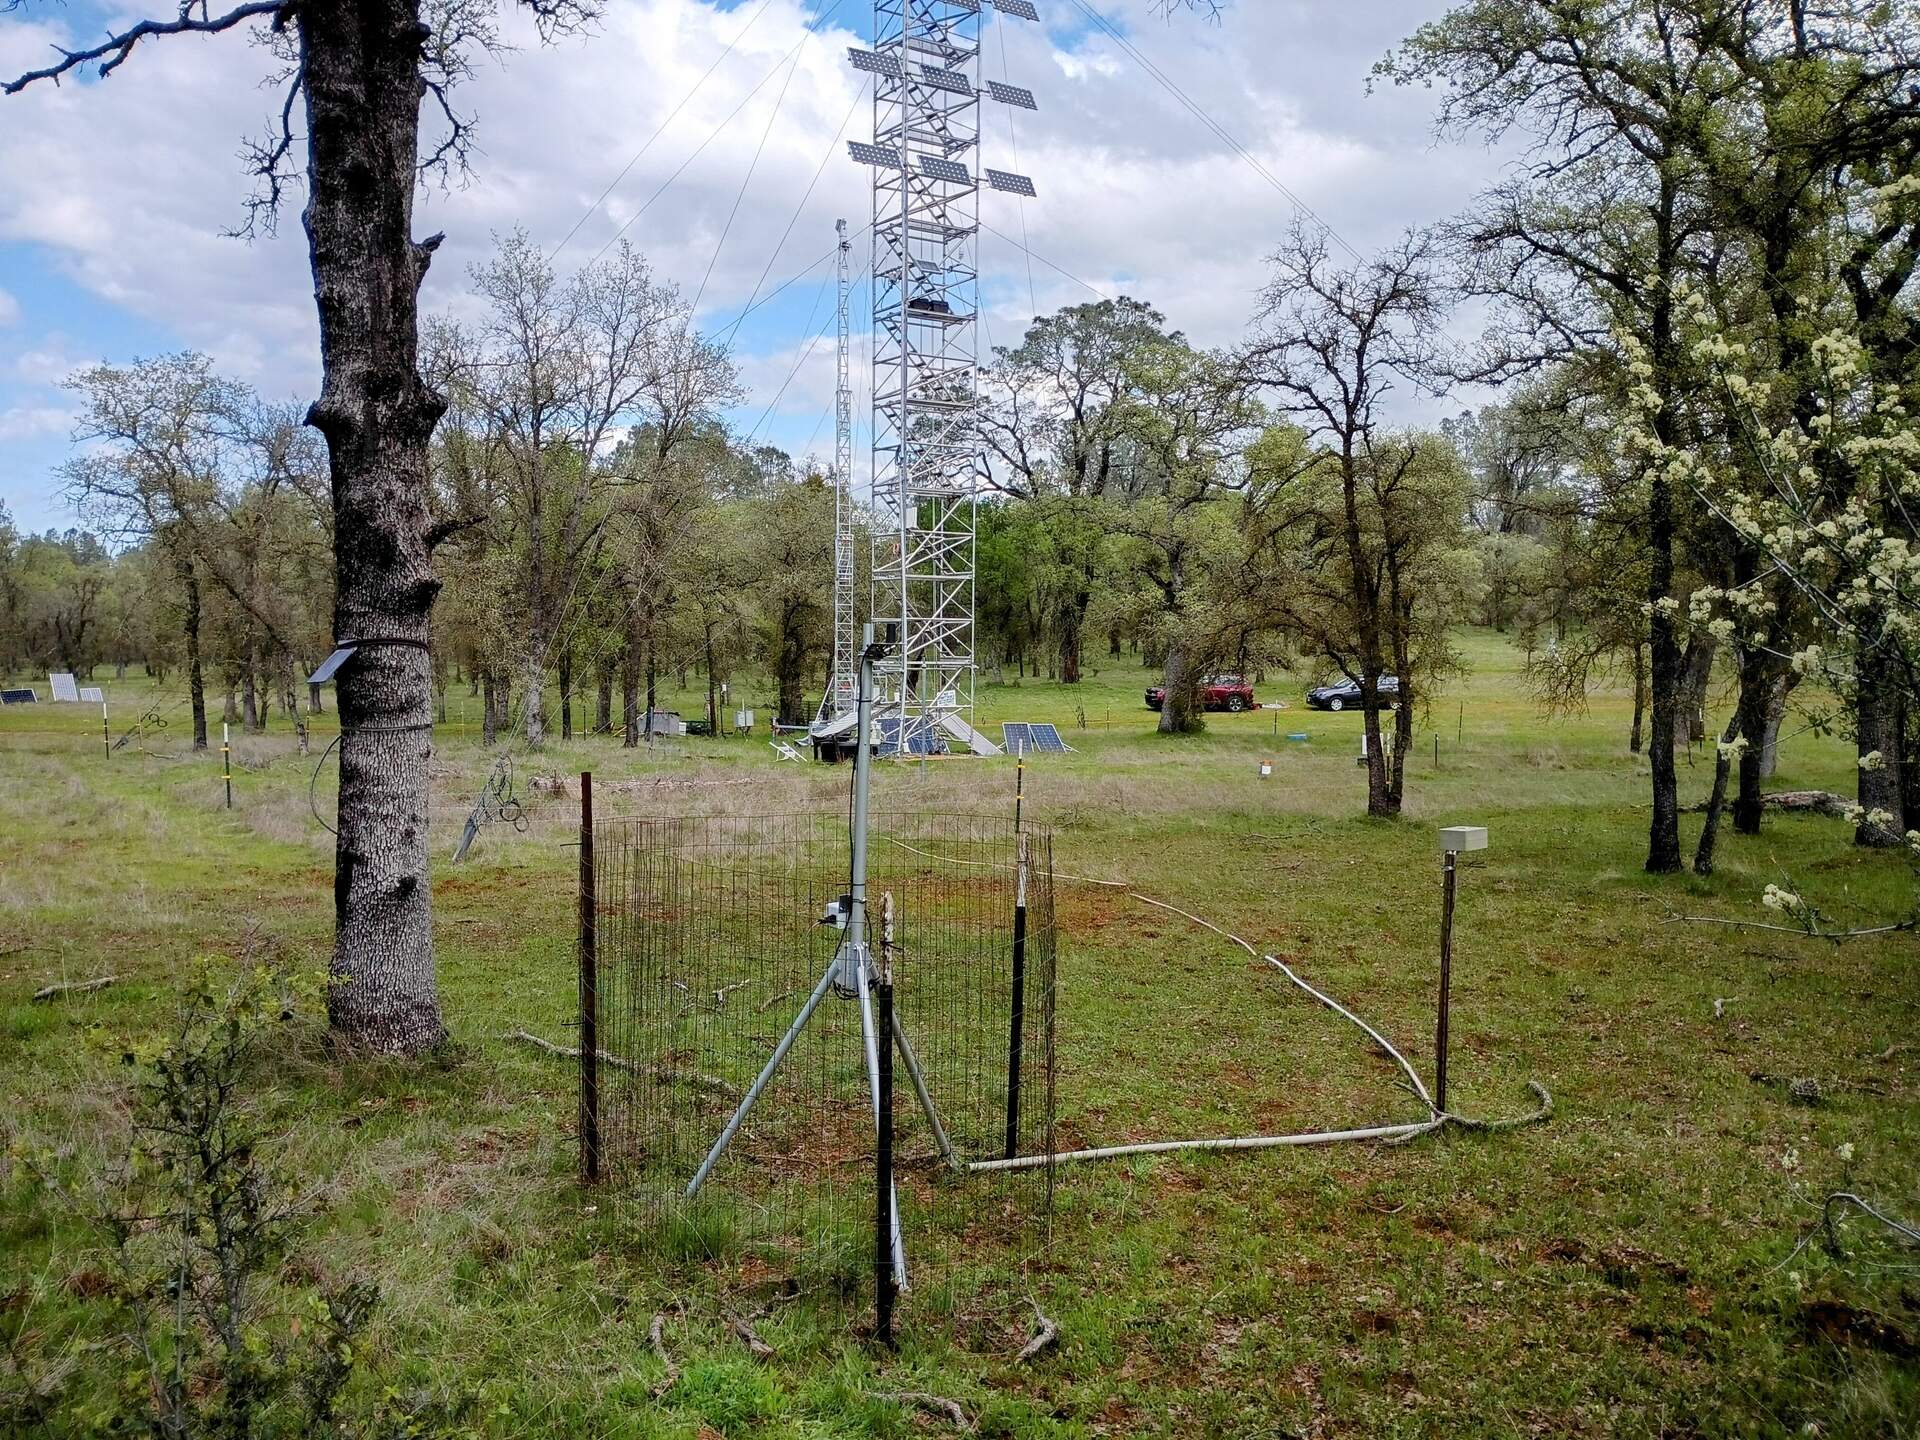
20250327TZ_HousenZcam1GPS.jpg ( 2025-03-27 13:06:39 ) Full size: 1920x1440
Housen's GPS unit near Zcam1
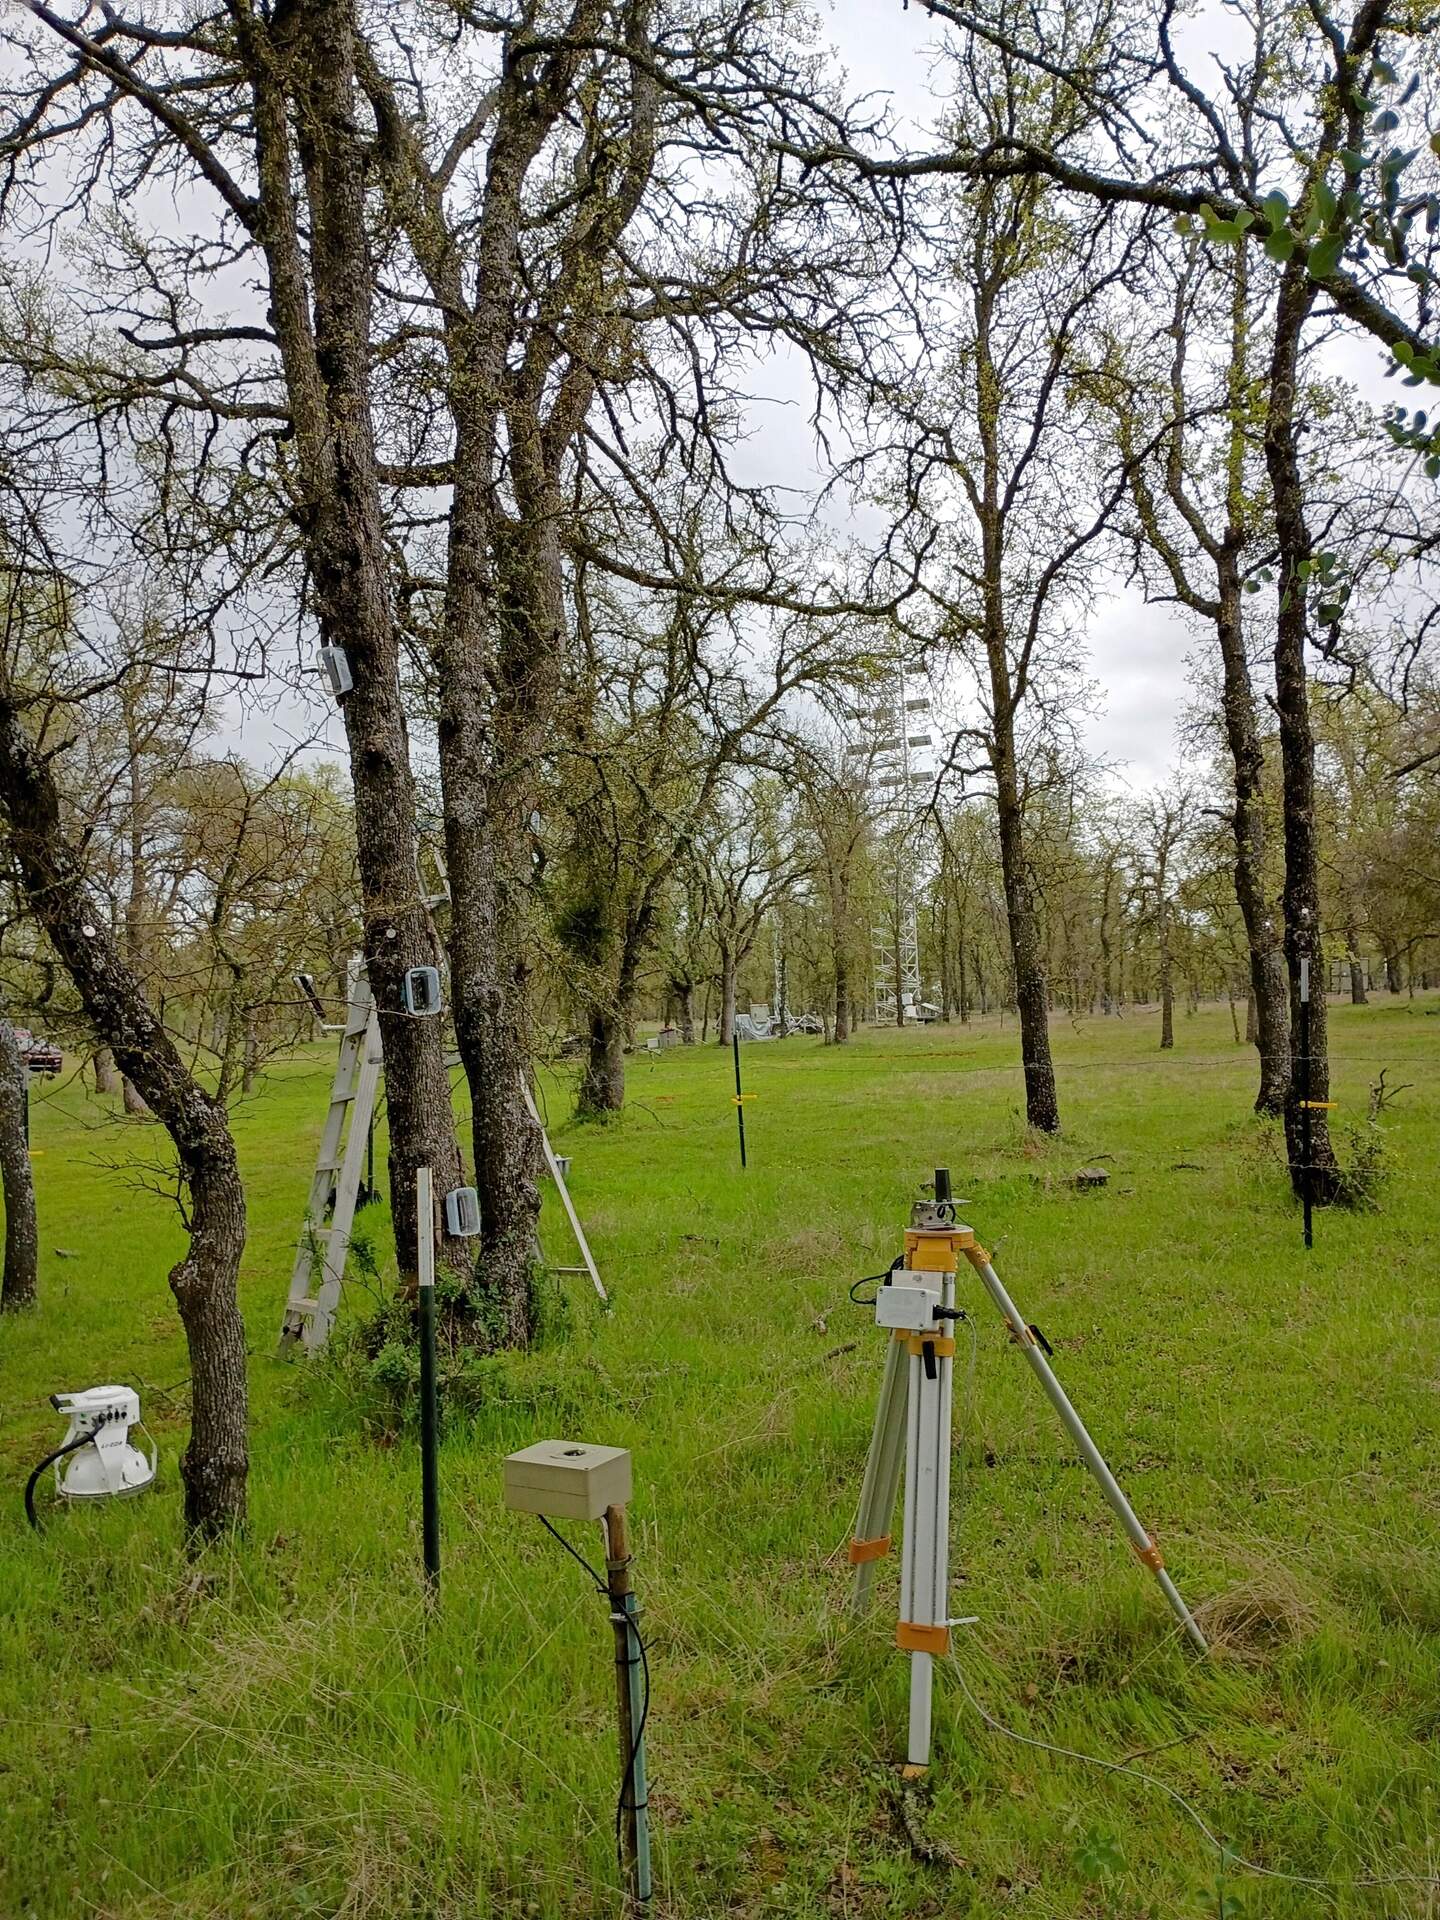
20250327TZ_HousenFloorGPS.jpg ( 2025-03-27 11:05:38 ) Full size: 1440x1920
Housen's GPS unit near the Floor tower.
16 sets found
No data found for TZ_Fenergy.
11 TZ_tmet graphs found
No data found for TZ_soilco2.
Can't check TZ_mixed
3 TZ_mixed graphs found
1 TZ_fflux graphs found
8 TZ_fmet graphs found
No data found for TZ_tram.
3 TZ_co2prof graphs found
1 TZ_irt graphs found
No data found for TZ_windprof.
1 TZ_tflux graphs found
8 TZ_sm graphs found
Can't check TZ_met
1 TZ_met graphs found
Can't check TZVR_mixed
8 TZ_osu graphs found
3 TZ_fd graphs found
Tonzi Z-cam data