Field Notes
<--2025-05-28 08:40:00 |Other sites visited today: Hill Slough | Rush Ranch
Phenocam link: Searching...
Gilbert Tract: 2025-06-10 12:10:00 (DOY 161)
Author: Joe Verfaillie
Others:
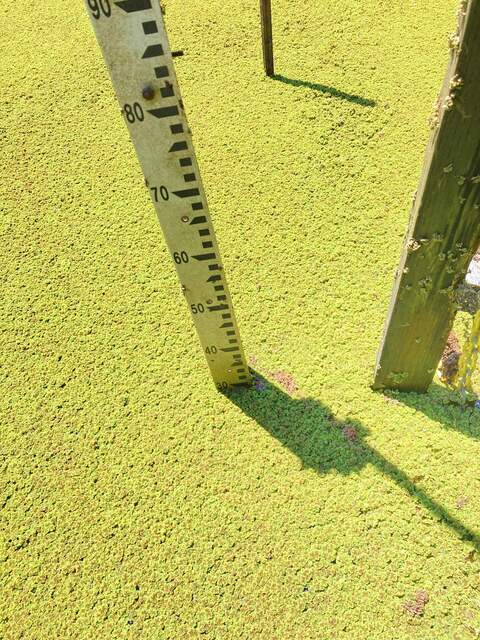
Summary: All channel data okay, forgot phenocam images maybe, knocked down a couple wasp nests, replaced two boardwalk posts, Azolla is fully back and super green
| Gilbert Tract 2025-06-10 I arrived at about 13:10 PDT. It was clear sunny and mild with a strong breeze from the west. Tide was pretty low. There was a USGS truck parked at the cul-de-sac but I didn't see anyone. I pulled a bunch of pepperweed from near the tower - didn't get it all. They have trimmed some of the plants encroaching on the road, but we probably need to cut a new path to the tower. There was some irrigation going on that made the path near the solar panels muddy. I started at the channel. Surprisingly everything seemed to be working. I got EXO data from the CR6. The ADCP seemed complete and clean. I stopped and restarted logging - I couldn't find anywhere to check the time. Even the miniCH4 seemed to have a full set of data. I stopped the logging, downloaded the miniCH4 data, cleared the data and restarted the timed logging with a time about 6min in the future. At the Tower about 12:30 PDT the Azolla has completely filled in the areas to Kuno cleared. The new growth is much brighter green than the old growth. I collected the met and flux, but seemed to have (hopefully) forgot to swap the camera card - no images on the card I have. I cleaned the eddy sensors and the radiometers. The 7500 read: 417.8ppm CO2, 738.5mmol/m3 H2O, 27.4C, 101.1kPa, 97.8SS - 99.5 after cleaning The 7700 read: 2.08ppm CH4, 41.5RSSI - 81.1 after cleaning I topped off the wash reservoir. I collected sound files from the Song Meter. It said its batteries were still at 100% so I put it back up. There were a couple of wasp nest under the middle boardwalk that I knocked down. I read the staff gauge and measured conductivity. The staff gauge read 28cm at 13:01 PST. Surface, 352.7uS, 26.6C, Only a few cm between the Azolla and the muck. The floating miniDot was hanging in the air with its chain tangled in the boardwalk. I untangled it and floated it again. I worked on replacing some of the chewed boardwalk posts. There seemed to be new chewing on the top of a couple posts. I completely replace the two most badly chewed posts. The bolts and screws came out without much trouble. I pounded in new posts with a big rock I found near the channel, drilled new holes for the bolts and put the screws back in. To the two new posts and one of the old posts I added plastic guards on the edges. I cut lengthwise some of the 1-1/2" ABS pipes that were the original legs for the boardwalk. These fit perfectly over the edges of the 2x4s and I screwed them in place. I'll get photos next time. I think I can add the guards to the other three posts next time. I left at about 15:06 PDT |
1 photos found

20250610GT_SuperGreenAzolla.jpg ( 2025-06-10 14:01:28 ) Full size: 1440x1920
Staff gauge and super green Azolla on the water surface
8 sets found
Can't check MBWPEESWGT_mixed
Can't check MBEEWPSWEPGT_cam
16 GT_met graphs found
4 GT_flux graphs found
3 GT_adcp graphs found
No data found for GT_cam.
2 GT_usgs graphs found
2 GT_chanexo graphs found

