Field Notes
<--2023-02-01 12:17:00 | 2023-03-02 13:35:00-->Other sites visited today: Hill Slough | Bouldin Corn | Bouldin Alfalfa | East End | Mayberry | Gilbert Tract
Phenocam link: Searching...
West Pond: 2023-02-14 14:00:00 (DOY 45)
Author: Daphne Szutu
Others: Carlos
Summary: Regular data collection/cleaning, cold and windy, updated picam program to latest version with file compressions
| 2023-02-14 West Pond Carlos and I arrived at 14:00 PST. It was partly sunny with patchy clouds and cold wind gusts. The staff gauge read 50cm and the water was covered with duckweed. I downloaded met, cam, and USB GHG data. Carlos cleaned flux and rad sensors. I changed the eddy clock +1min from 14:06:20 to 14:07:20 and restarted logging. The wash reservoir was full so we did not top it off. Carlos reported that there was cattail fluff stuck on the sonic transducers and one of the sonic bird spikes had rotated downwards (he fixed it). It was cold so Carlos and I waited in the car to download the picam photos. After the download, I cleared the photos and updated the picam software to the latest version that has file compression. However, after restart the webpage would not load because I forgot to enable "execute" for all groups. I logged in again via WinSCP to add "x" for all. I cycled the camera's power manually to reboot the camera and all seemed well. The 7500 read: 409ppm CO2, 294mmol/m3 H2O, 12.1C, 101.4kPa, 102SS--107 after cleaning The 7700 read: 2.0ppm CH4, 56RSSI--89 after cleaning We left at 14:25 PST. |
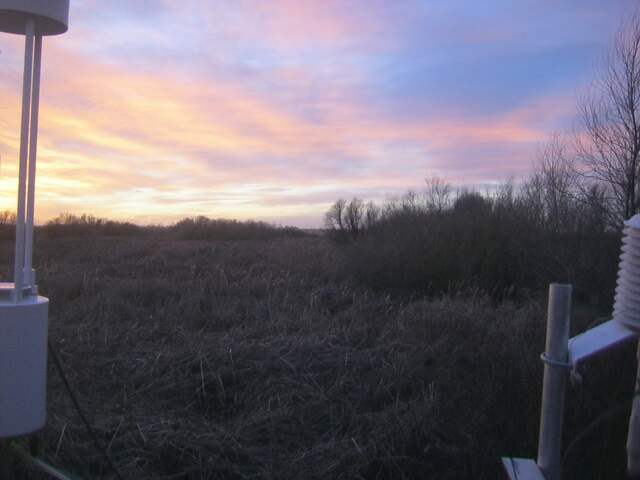
1 photos found

WP_autocam_20230213_1745.jpg ( 2023-02-13 17:45:01 ) Full size: 1920x1440
Nice sunset colors
8 sets found
Can't check WP_DO
1 WP_DO graphs found
14 WP_met graphs found
5 WP_flux graphs found
Can't check MBWPEESWGT_mixed
Can't check MBEEWPSWEPGT_cam
Can't check MBSWEEWPBCBA
1 WP_processed graphs found
4 WP_arable graphs found

