
Field Notes
<--2023-02-14 12:30:00 | 2023-03-13 11:50:00-->Other sites visited today: Hill Slough | Bouldin Corn | West Pond | East End | Mayberry | Gilbert Tract
Phenocam link: Searching...
Bouldin Alfalfa: 2023-03-02 12:20:00 (DOY 61)
Author: Daphne Szutu
Others: Kyle
Summary: Regular data collection/cleaning, alfalfa heavily grazed by geese, more rain to come
| 2023-03-02 Bouldin Alfalfa Kyle and I arrived at 12:20 PST. It was cool but mostly sunny with not much of a breeze, so it didn’t feel too cold. There was about 5cm of rain last week, and more rain is expected at the end of next week. Given the wet soils, I don't think the farmers will be tearing up this field any time soon. The alfalfa is very short and the field generally looks very brown and bare. There is a green zone around the tower and the solar panels, though. I noticed more weeds today than I have in past years—not sure if they just stand out more with most of the alfalfa gone (do the geese prefer to eat the soft alfalfa over random weeds?). Kyle noticed quite a few bird pellets on the ground around the scaffolding and under the rad boom. I downloaded met, cam, USB GHG, FD, and IRT data. I changed the eddy clock +1min to match the laptop time and restarted logging. Kyle cleaned flux and rad sensors. There were some sleepy wasps in the met box. I shooed out most of them and left one mothball in the box. The 7500 read: 428ppm CO2, 287mmol/m3 H2O, 16.0C, 102.1kPa, 105SS--106 after cleaning We left around 13:00 PST. |
Next Mowing: 2023-03-05
2 photos found
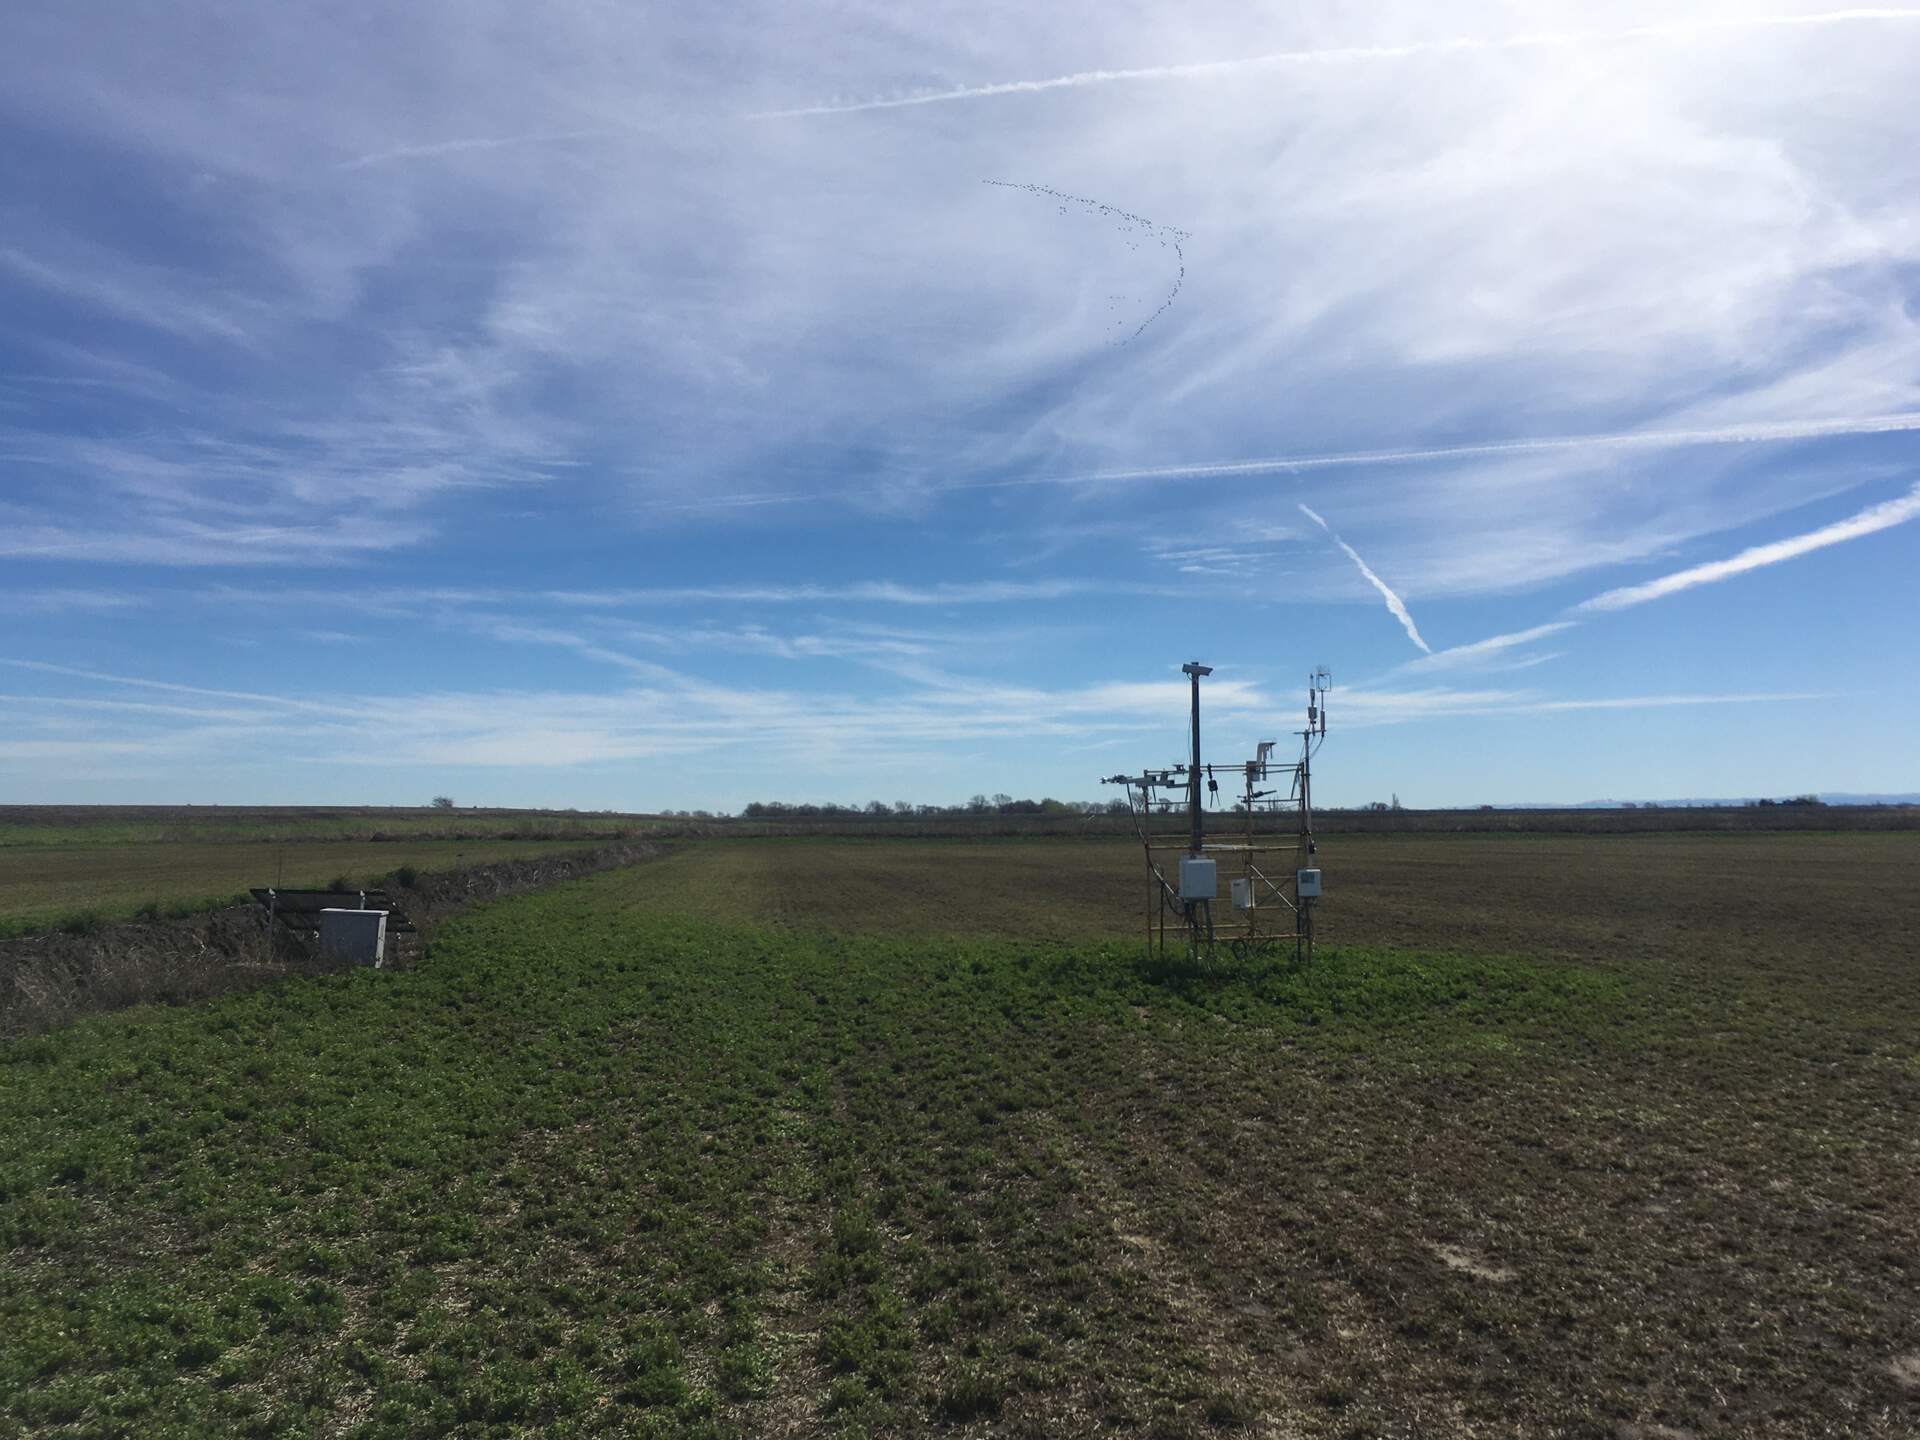
20230302BA_Oasis.jpg ( 2023-03-02 13:00:24 ) Full size: 1920x1440
Most of the field has been grazed by geese or other birds, but there's are green patches around the tower, close to the solar structure, and along the edges of the field.

bouldinalfalfa_2023_03_02_124506.jpg ( 2023-03-02 20:46:08 ) Full size: 1296x960
Kyle on heavily grazed field
7 sets found
4 BA_flux graphs found
21 BA_met graphs found
6 BA_arable graphs found
Can't check TATWBABCSB_cam
Can't check MBSWEEWPBCBA
2 BA_processed graphs found
No data found for BA_adex.