Field Notes
<--2022-12-21 12:00:00 | 2023-01-25 11:00:00-->Other sites visited today: Tonzi | Hill Slough | Bouldin Corn | Bouldin Alfalfa | West Pond | East End | Mayberry
Phenocam link: Searching...
Vaira: 2023-01-06 11:00:00 (DOY 6)
Author: Joe Verfaillie
Others:
Summary: First visit of the year, several big storms past more to come, standard data collection, all looks well
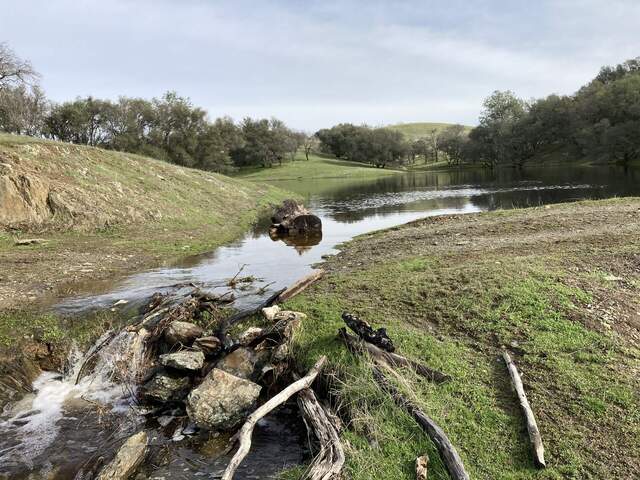
| Vaira 2023-01-06 I arrived at about 11:00am. It was overcast and cool with a breeze from the southeast at about 135 deg true. There have been several big storms over the Christmas/New Year’s holidays. Both Jackson Road from Sacramento and Twin Cities Rd from the Delta were closed due to flooding and Twin Cities is still closed. Here, there is almost no evidence of the storms other than the extra water – rivulets and puddles in the road. I assume the water hole was full but I was concentrating on getting through the puddles when I drove past it. I drove down the hill to the creek but got out, jumped the creek and walked the rest of the way to the pond. The pond was full to over flowing. At the site I measured the well, and collected the flux, met, camera and FD data. No problems noticed. The 7500 read: 428.2ppm CO2, 320.6mmol/m3 H2O, 18.2C, 100.5kPa, 102.4SS The sonic is aligned close to magnetic north at 16deg true. The equipment was dry – no water droplets on anything so probably been windy and dry for a bit. The grass cover has not changed much – no spectra today as the equipment is being used in the Delta. I left at 11:50 |
Field Data
No tank data
Well Depth
| Date | Location | Depth (feet) |
|---|---|---|
| 2023-01-06 | VR_well | 56.45 |
| 2023-01-06 | VR_pond | 22.42 |
| 2023-01-06 | TZ_floor | 29.15 |
| 2023-01-06 | TZ_tower | 33.55 |
| 2023-01-06 | TZ_road | 36 |
| 2023-01-06 | HS | 4.94 |
| 2023-01-06 | WP | 1.15 |
| 2023-01-06 | EE | 1.05 |
| 2023-01-06 | MB | 1.67 |
No TZ Moisture Point data found
No VR Moisture Point data found
No TZ grass heigth found
No VR grass heigth found
No VR Tree DBH found
No water potential data found
No VR Grass Biomass data found
No VR OakLeaves Biomass data found
No VR PineNeedles Biomass data found
2 photos found

20230106VR_PondSpillway.jpg ( 2023-01-06 11:43:51 ) Full size: 1920x1440
The pond is full and spilling over after the recent storms

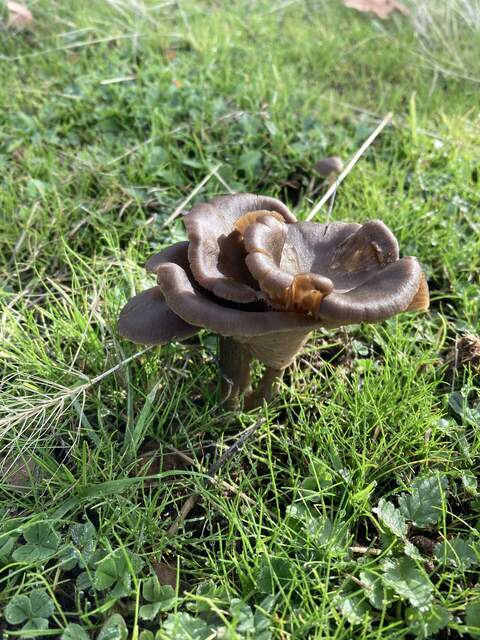
20230106VR_LittleMushroom.jpg ( 2023-01-06 10:59:09 ) Full size: 1440x1920
Little brown mushrooms coming up everywhere
9 sets found
16 VR_met graphs found
2 VR_flux graphs found
No data found for VR_soilco2.
2 VR_pond graphs found
Can't check TZVR_mixed
3 VR_fd graphs found
4 VR_processed graphs found
4 VR_arable graphs found
6 VR_soilvue graphs found

