Field Notes
<--2023-01-03 14:30:00 | 2023-01-19 12:00:00-->Other sites visited today: Vaira | Tonzi | Hill Slough | Bouldin Alfalfa | West Pond | East End | Mayberry
Phenocam link: Searching...
Bouldin Corn: 2023-01-06 12:10:00 (DOY 6)
Author: Daphne Szutu
Others: Dennis
Summary: Regular data collection/cleaning, line power still out but should be fixed today, 7500 bad--swapped, talked to Russ Ryan, storms this week and more rain to come
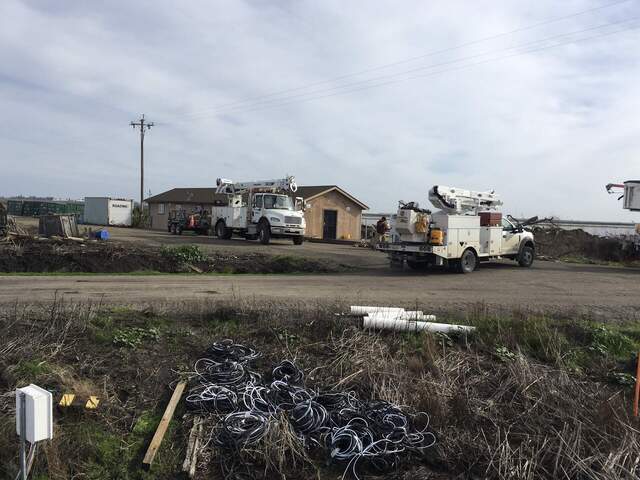
| 2023-01-06 Bouldin Corn Dennis and I arrived at 12:10 PST. It was cool, breezy, and mostly overcast with a tiny sliver of sunshine peeking through. We’ve had a string of atmospheric river storms since late December. More storms with potentially high wind are expected this weekend and next week. According to the PG&E power map, a new power outage started on Bouldin Island on the morning of 2023-01-04. Charlotte was here earlier in the day and confirmed the line power was still off. A crew to repair the power lines arrived just before us. They said the wind had been “horrendous” and resulted in a “a couple of poles down.” The water on the field is still high, just low enough to walk around in knee-high boots. If it stays like this for much longer, maybe we can consider it our newest wetland site in the Delta. We removed both boardwalks earlier this week to prepare for the windy storms. Dennis and I hefted the boardwalks up onto the tower so we could access everything. Since line power was still down, I used a lithium power pack to talk to the CR1000, then talk to the 7550/7700. I downloaded met, cam, USB GHG, PA, and IRT data. I didn’t download FD data because we removed the FD chamber earlier this week after we found it floating in the water. Dennis cleaned flux and rad sensors. CO2/H2O numbers were **.** and the 7550 temperature was bad when we arrived. The USB GHG data had weird data (multiple small files, duplicated data lines) at the last data download, but the data this time seemed ok. We decided to start with just swapping the 7500A today: sn 1594 came off and sn 0041 went on. I loaded a new config file, updated the pressure coefficient, reset the eddy clock from +45sec to match the laptop time from 13:12:45 to 13:30:30, and reset the 7550 box. All seems ok except for the 7550 temperature. We probably need a new sensor—I think there are spares in the lab. I don't think this temperature is used in data processing. 7500 sn 1594 read: **ppm CO2, **mmol/m3 H2O, -33C, 96.5kPa, 0SS (pressure is low but the 30min data seems reasonable--need to check 20Hz data) 7500 sn 0041 read: 363ppm CO2, 486mmol/m3 H2O, -28C, 102.2kPa, 101SS The 7700 read: 2.0ppm CH4, 75RSSI after cleaning Dennis cleaned flux and rad sensors and topped off the wash reservoir. Russ Ryan, the manager for the MWD Delta islands, drove by while we were there and chatted for a while. About alfalfa, he said he would follow up with Rob, the owner of Sierra cattle. He mentioned MWD is trying to include migrating waterfowl habitat in its Delta strategy—besides the leftover grain in rice field and habitat in flooded fields, he said migrating waterfowl also love the invertebrates on alfalfa fields. He also mentioned that they are experimenting with raising Delta smelt in ponds—a recent experiment consisted of getting 300+ Delta smelt from a hatchery and putting them in a predator-proof cage in a pond. They only lost about 2% of the smelt, demonstrating that the ponds provided sufficient habitat for the smelt to survive. Maybe related to Steve Deverel’s floating tule mats? Dennis and I removed the boardwalks again to prep for the next set of storms. We left at 13:40 PST. Line power was still off when we left. Since the power crew was blocking the road past the duck club, we turned around and rejoined the freeway by the overpass. The dirt on-ramp was full of waterlogged potholes—do not recommend this route. |
1 photos found

20230106BC_PowerCrew.jpg ( 2023-01-06 12:34:00 ) Full size: 1920x1440
Power crews arrived on site to fix some downed poles from our recent spate of atmospheric river storms
6 sets found
17 BC_met graphs found
5 BC_flux graphs found
Can't check TATWBABCSB_cam
Can't check MBSWEEWPBCBA
2 BC_pa graphs found
1 BC_arable graphs found

