Field Notes
<--2018-10-04 09:30:00 | 2018-10-25 15:05:00-->Other sites visited today: Bouldin Alfalfa | West Pond | East Pond | East End | Sherman Wetland | Mayberry | Sherman Barn
Phenocam link: Searching...
Bouldin Corn: 2018-10-18 09:30:00 (DOY 291)
Author: Joe Verfaillie
Others: Daphne, Kyle
Summary: Tested tipping bucket, swapped 7500, untangled one set of soil sensors from chamber cables.
| Bouldin Corn 2018-10-18 I arrived at 9:30 with Daphne and Kyle. It was sunny and mild with hazy horizons and little wind. Tyler and Brian were there working on the chambers. The field is not flooded, but there were lots of geese making noise in the air. We cleaned and tested the tipping bucket sn 65548-615. We connected it to a CR6 and dribbled 475ml of water through it. This should result in 100 tips – we got 94 tips. We adjusted the set screws in the bottom by one half turn clockwise (+2-3%). We swapped the 7500, sn 75H-2182 came off and sn 75H-2668 went on. 2182 read: 400ppm CO2, 793mmol/m3 H2O, 15.9C, 101.5kPa, 82SS 2668 read: 437ppm CO2, 555mmol/m3 H2O, 16.7C, 101.5kPa, 101SS The pressure coefficients were updated and the box restarted. The 7700 read: 2.02ppm CH4, 44RSSI – 84 after cleaning. The wash reservoir was full – Kyle topped it off. I removed and reinstalled the northern most set of ground sensors. This was to untangle their cables with Tyler’s chamber cables. I also cut a bunch of the Johnson grass near the tower but still a lot there that needs cutting. We left at 10:00 |
1 photos found

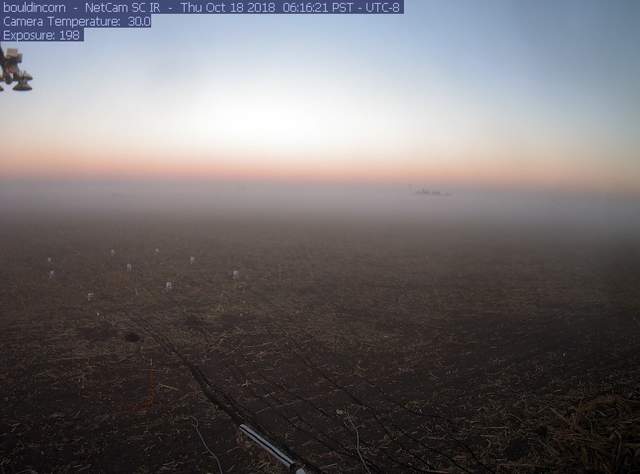
bouldincorn_2018_10_18_061505.jpg ( 2018-10-18 06:24:36 ) Full size: 1296x960
Tule fog at dawn.
6 sets found
17 BC_met graphs found
5 BC_flux graphs found
Can't check TATWBABCSB_cam
Can't check MBSWEEWPBCBA
No data found for BC_pa.
1 BC_arable graphs found

