
Field Notes
<--2018-10-04 13:40:00 | 2018-11-01 12:50:00-->Other sites visited today: Bouldin Corn | Bouldin Alfalfa | West Pond | East Pond | East End | Sherman Wetland | Mayberry
Phenocam link: Searching...
Sherman Barn: 2018-10-18 15:20:00 (DOY 291)
Author: Joe Verfaillie
Others: Daphne, Kyle
Summary: Chamber system possibly hung up, tested tipping bucket, 7700 TC broken.
| Sherman Barn 2018-10-18 I arrived at 15:20 with Daphne and Kyle. It was sunny and warm with little to no wind. Nice new blacktop road along the top of the levee. We did not see any of the chambers close while we were there. All chambers were open but looked otherwise undisturbed. We forgot the key to the Picarro box so could not further check on the system. Weeds are growing inside cow fence. We swapped the 7500 for calibration – sn 0041 came off and sn 75H-2669 went up 0041 read: 414.0ppm CO2, 593mmol/m3 H2O, 29.4C, 101.9kPa, 94SS 2669 read: 422.9ppm CO2, 455mmol/m3 H2O, 29.2C, 101.8kPa, 103.6SS The 7700 read: 0.085mmol/m3 CH4, 2RSSI – 66 after cleaning The wash reservoir was empty and RSSI low due to many spider webs on the eddy sensors. The 7700 thermocouple has also broken so the CH4 ppm values were bad, but the density looked okay. Daphne did spectral measurements: samples 10-21 ref/dark x5, ref/dark x5. We cleaned and tested the tipping bucket sn 49187-109. We connected it to a CR6 and dribbled 475ml of water through it. This should result in 100 tips – we got 94 tips. We adjusted the set screws in the bottom by one half turn clockwise (+2-3%). We left at 16:00 |
1 photos found
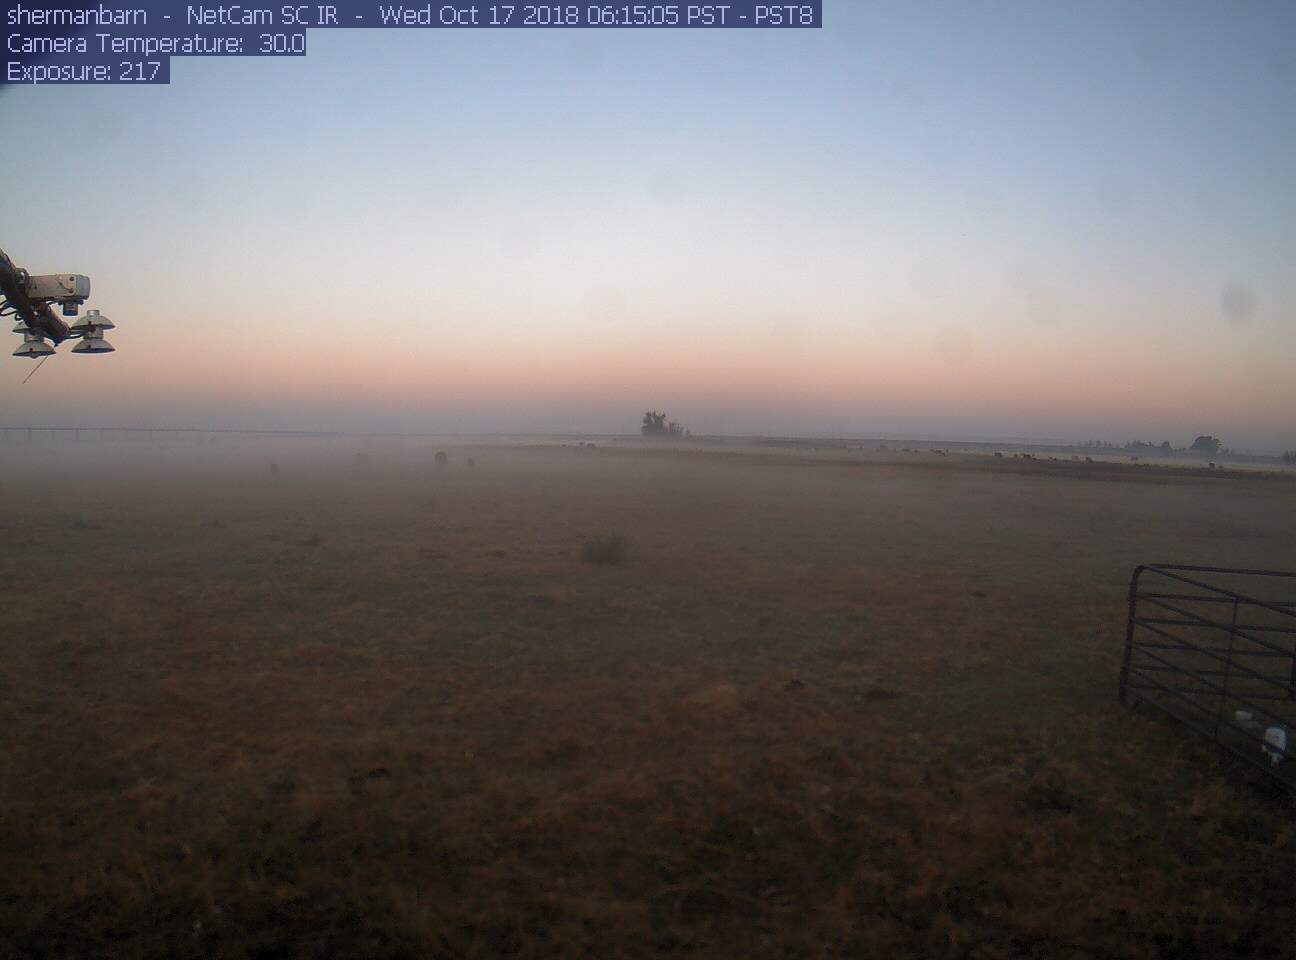
shermanbarn_2018_10_17_061505.jpg ( 2018-10-17 06:20:26 ) Full size: 1296x960
Tule fog at Dawn
3 sets found
4 SB_flux graphs found
15 SB_met graphs found
Can't check TATWBABCSB_cam