Field Notes
<--2014-10-09 14:00:00 | 2014-10-30 10:00:00-->Other sites visited today: Twitchell Rice | East End | West Pond | Twitchell Alfalfa | Sherman Island
Phenocam link: Searching...
Mayberry: 2014-10-16 15:00:00 (DOY 289)
Author: Joe Verfaillie
Others: Sara
Summary: Pulled post and TCs from PTower locations, added two FR CO2 sensors to DO/CO2 profile, swapped 7550-7500 cable and pressure port gasket, standard data collection.
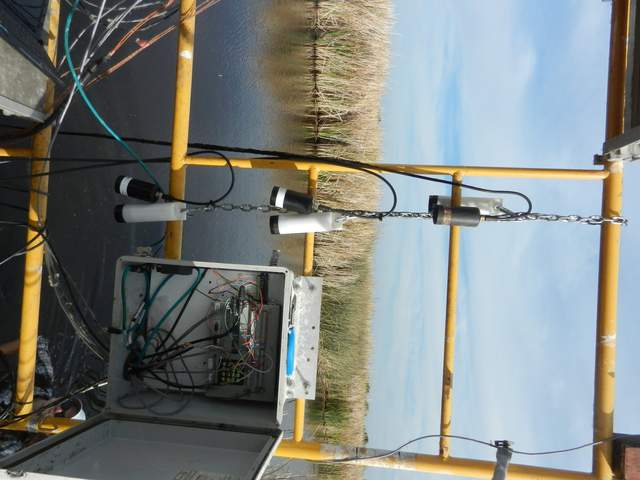
| Mayberry 2014-10-16 I arrived about 3:00 with Sara. It was warm and still with high thin clouds. I notice little change in the site conditions from last time. We pulled the fence posts from the portable tower locations and the TC profile from the Low Veg site. The water level is back to normal at the Low Veg site. At the main tower we checked and collected data from the miniDOT DO sensors and then added the existing Forerunner CO2 probe and two new Forerunner CO2 probes to the miniDot profile. Sara reattached the string of sensors to the fence post in the channel with the top sensors about 25cm below the surface. The CO2 probes floated up a little bit though. 25cm below the surface: miniDOT sn 1220, FR CO2 sn GP20140010 65cm below the surface: miniDOT sn 1219, FR CO2 sn GP20140024 108cm below the surface: miniDOT sn 1221, FR CO2 sn GP20140025 We downloaded all the 23x data before uploading a new program. The new program removed disconnected sensors (Vaisala CO2, SHF) and put the Forerunner probes in the first six SE channels. We did the standard data collection. The 7500 read: 397ppm CO2, 500mmol/m3 H2O, 100SS, 24.5C, 101.3kPa The 7700 read: 1.99ppm CH4, 51.7RSSI – 70 after cleaning We swapped the cable between the 7550 box and the 7500A head per Licor’s orders. The GHG readings did not change after the cable swap. There is also a gasket upgrade to the pressure port of the 7550 box that we did. Sara cleaned the water sensors, collected water samples, and cleaned the radiation sensors. One of the tule radiation cables got smashed in the folding arm. The insulation was broken but the data seemed okay. I tapped the break. |
2 photos found

20141016MB_CO2-DOString.jpg ( 2014-10-16 15:35:05 ) Full size: 1920x1440
Three miniDOTs and three dissolved CO2 sensors will be attached to a fence post in the channel

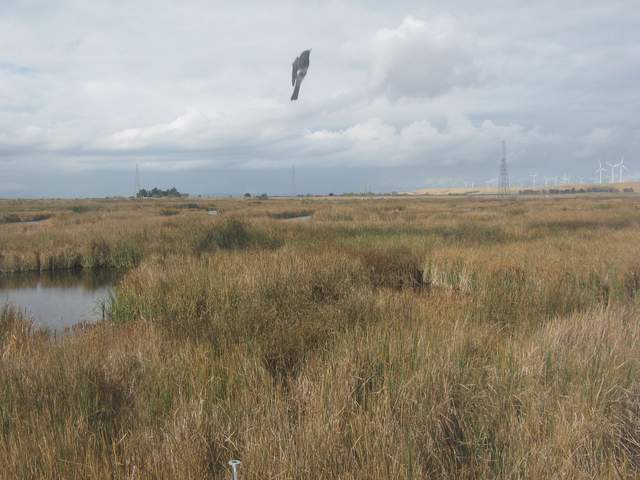
MB_autocam_20141015_1145.jpg ( 2014-10-15 11:45:02 ) Full size: 1920x1440
Bird in flight
11 sets found
7 MB_flux graphs found
No data found for MB_met.
28 MB_tule graphs found
Can't check MBWPEESWGT_mixed
1 MB_cam graphs found
Can't check MBEEWPSWEPGT_cam
Can't check SIMBTWEE_met
1 MB_minidot graphs found
Can't check MBSWEEWPBCBA
1 MB_processed graphs found
Can't check MB_fd
1 MB_fd graphs found

