
Field Notes
<--2014-10-09 09:00:00 | 2014-10-30 12:50:00-->Other sites visited today: Twitchell Rice | East End | West Pond | Sherman Island | Mayberry
Phenocam link: Searching...
Twitchell Alfalfa: 2014-10-16 12:45:00 (DOY 289)
Author: Joe Verfaillie
Others: Sara
Summary: Standard data collection, roads passable, added split loom to wires near tower, swapped 7550-7500 cable and pressure port gaskets.
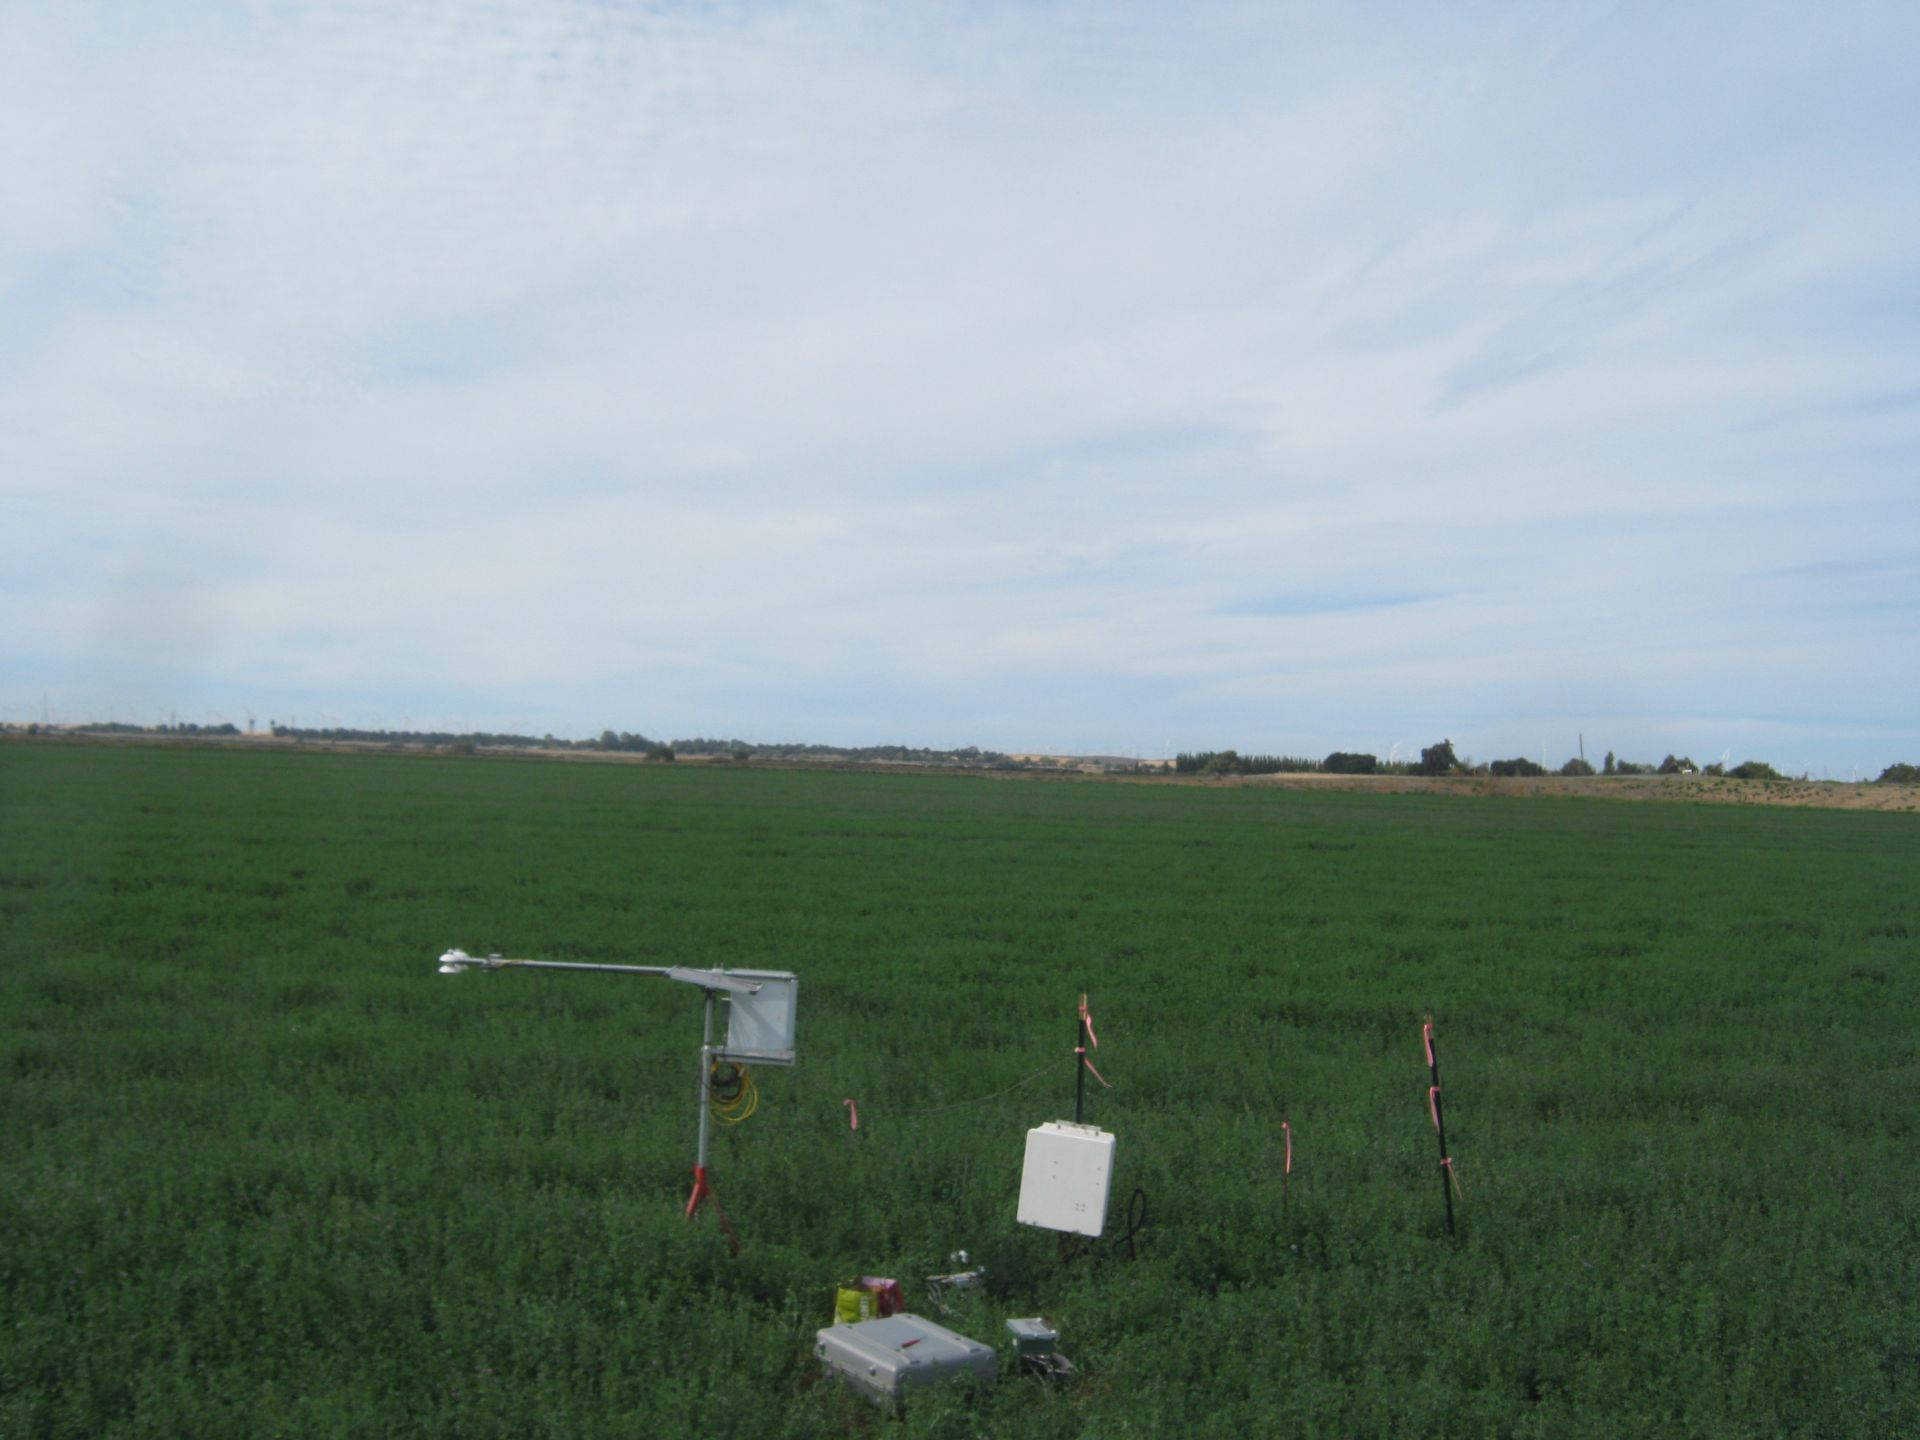
| Alfalfa 2014-10-16 I arrived about 12:45 with Sara. It was still and warm with high thin clouds. The road and ditch to the tower was largely dry. There was still some water in the bottom of the ditch along the road. The alfalfa has not been mowed yet and is beginning to flower. The squirrels chewed on the power line for the 6400. I repaired it and put split loom on most of the wires that are at squirrel level. Sara did soil respiration, clip plots, LAI, veg height, and spectral. I collected the data. The 7500 read: 380ppm CO2, 534.2mmol/m3 H2O, 80.1SS, 24.82C, 101.4kPa. I swapped the cable between the 7550 box and the 7500A head per Licor’s orders. The 7500 readings did not change after the cable swap. There is also a gasket upgrade to the pressure port of the 7550 box that I did. There are still a few wasps in the radiation data logger box. |
Veg Height (cm): Tape measure from ground to top of plant - Flowering
38, 25, 28, 52, 68, 58, 30, 41, 30, 20, 25, 12, 38, 42, 45, 50, 53, 48, 60, 30, avg = 39.7, stdev = 14.69
1 photos found
TA_autocam_20141016_1145.jpg ( 2014-10-16 11:45:03 ) Full size: 1920x1440
fieldwork
7 sets found
Can't check TA_met
11 TA_met graphs found
Can't check TA_rad
3 TA_rad graphs found
Can't check TA_flux
5 TA_flux graphs found
Can't check TA_soilco2
7 TA_soilco2 graphs found
No data found for TA_arable.
1 TA_cam graphs found
Can't check TATWBABCSB_cam