Field Notes

<--2014-10-09 11:45:00 | 2014-10-30 12:00:00-->
Other sites visited today: Twitchell Rice | West Pond | Twitchell Alfalfa | Sherman Island | Mayberry
Phenocam link: Searching...

East End: 2014-10-16 11:15:00 (DOY 289)
Author: Joe Verfaillie
Others: Sara

Summary: Standard data collection, water a little higher.

East End
2014-10-16

I arrived about 11:15 with Sara. It was warm with high thin clouds and little breeze. The water level seems higher; the top of the well was underwater. The cattails are still growing and getting really tall.

We did the standard data collection.

The 7500 read: 15.95mmol/m3 CO2, 574mmol/m3 H2O, 101.6kPa, 24.6C, 249diag
The 7700 read: 1.95ppm CH4, 57.0RSSI – 87 after cleaning.
We topped off the wash reservoir.

Sara collected water samples and cleaned the water sensors – the water sensors were gross.

The radiometers were cleaned. Next time bring the big shears to clear the path and in front of the solar panels.

1 photos found

Debris burn pile
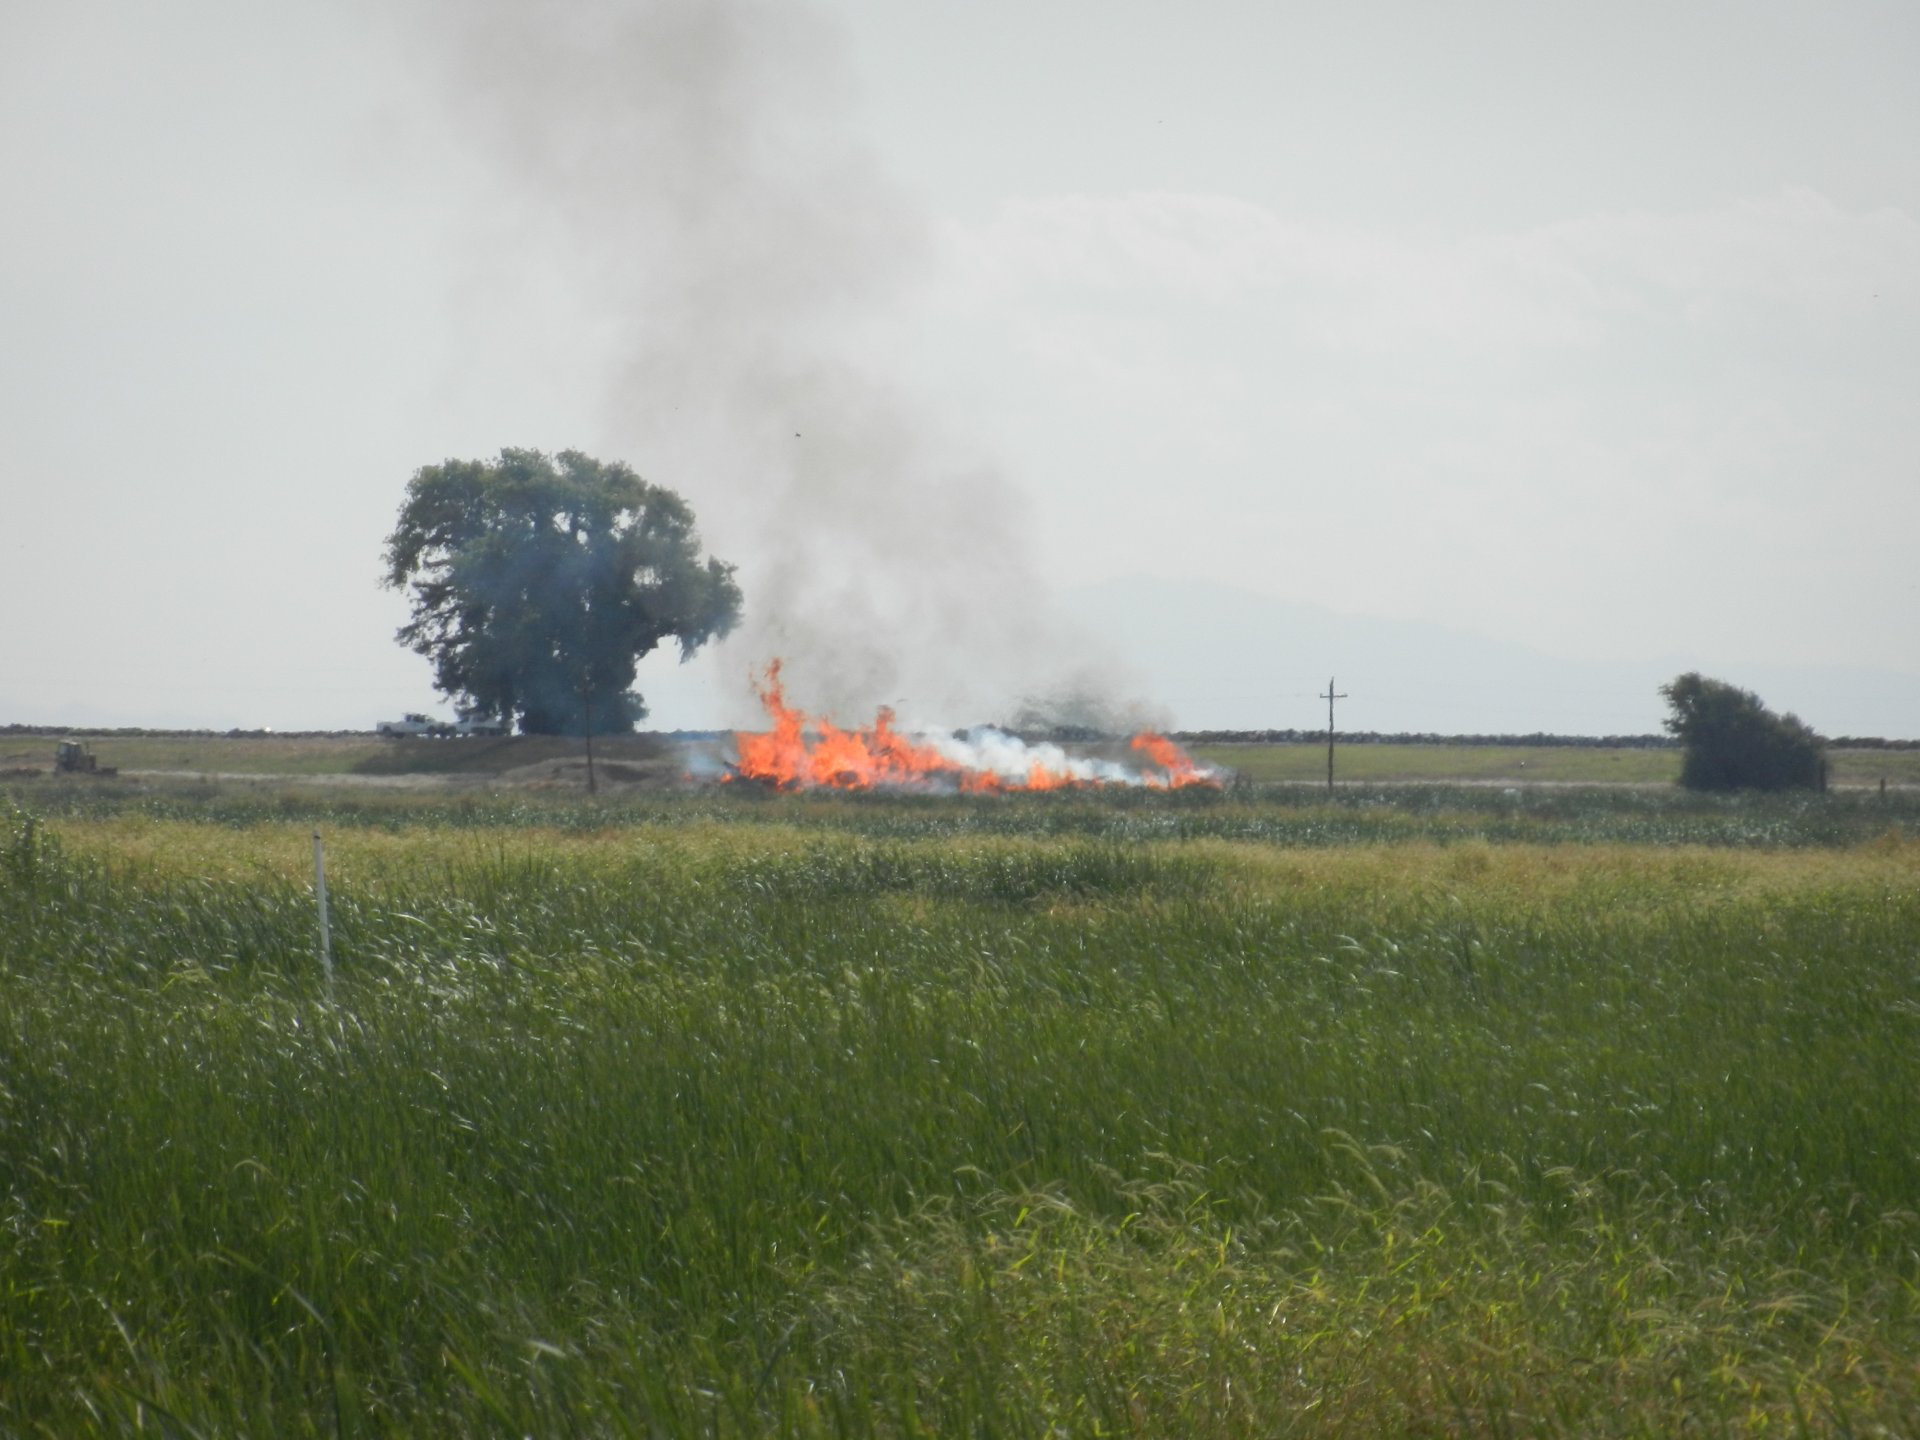
20141016EE_DebrisBurn.jpg ( 2014-10-16 12:12:47 ) Full size: 1920x1440
Debris burn pile

Graphs display:
11 sets found

14 EE_met graphs found

Explore the graph:Temperature and Batt V in a new window

Explore the graph:Soil Moisture and Well Pressure in a new window

Explore the graph:Solar Radiation in a new window

Explore the graph:PAR in a new window

Explore the graph:Soil Heat Flux in a new window

Explore the graph:Water Level and Rain in a new window

Explore the graph:Soil/Water Temperature Set 1 in a new window

Explore the graph:Soil/Water Temperature Set 2 in a new window

Explore the graph:Soil/Water Temperature Set 3 in a new window

Explore the graph:Dissolved Oxygen and Wind Speed in a new window

Explore the graph:SRS NDVI Channels in a new window

Explore the graph:Apogee NDVI in a new window

Explore the graph:NDVI in a new window

Explore the graph:Undercanopy PAR in a new window

Can't check EE_mixed
1 EE_mixed graphs found

Explore the graph:Air Pressure and RH in a new window

8 EE_flux graphs found

Explore the graph:Wind Speeds in a new window

Explore the graph:LI7500 CO2 and H2O in a new window

Explore the graph:LI7700 CH4 and RSSI in a new window

Explore the graph:Flux Counts in a new window

Explore the graph:Instument Temperatures in a new window

Explore the graph:Temp Tower 3 (Mixed Veg) in a new window

Explore the graph:Temp Tower 3 (Mixed Veg) in a new window

Explore the graph:Temp Tower 3 (Mixed Veg) in a new window

Can't check MBWPEESWGT_mixed
1 EE_cam graphs found

Explore the graph:EE Autocam GCC in a new window

Can't check MBEEWPSWEPGT_cam
Can't check SIMBTWEE_met
Can't check EE_Temp
5 EE_Temp graphs found

Explore the graph:Sonic SOS in a new window

Explore the graph:LI7500 CO2 in a new window

Explore the graph:Water Level in a new window

Explore the graph:LI-7700 CH4 in a new window

Explore the graph:Wind Speed in a new window

Can't check EE_minidot
1 EE_minidot graphs found

Explore the graph:EE miniDOT Dissolved Oxygen in a new window

Can't check MBSWEEWPBCBA
1 EE_processed graphs found

Explore the graph:CO2 Fluxes in a new window