
Field Notes
<--2025-04-10 14:30:00 | 2025-05-15 02:20:00-->Other sites visited today: Tonzi
Phenocam link: Searching...
Vaira: 2025-04-29 14:30:00 (DOY 119)
Author: Joe Verfaillie
Others: Kuno
Summary: Swapped 7500 for calibration, added second reflected PAR to check, fixed broken connection on tipping bucket, forgot to get the phenocam photos, went to the pond
| Vaira 2025-04-29 Kuno and I arrived at about 15:30 PDT. It was mostly clear, sunny and hot. There was a veil of high thin clouds. The roads are dry but the water hole is mostly full and the stream is running. The grass is about 50cm tall and there is a large patch of vetch with purple flowers to the southwest of the tower. The grass inside of the Davis biomass fence is almost entirely block by last year's litter. See the photo. I couldn't get the Jaz spectrometer to work. It was complaining that it was too bright which I don't believe as it was a little hazy, diffuse. Kuno did the well. I collected the flux, met and FD data. I forgot to get the Phenocam photos - should be okay until next time. The FD data threw a bunch of errors - probably a bad sensor. I need to check the data and probably pull the sensor - we are down to two FD chambers at Tonzi now. I swapped the 7500 for calibration: sn 0035 came off and sn 0073 went on. 0035 dirty read: 427.9ppm CO2, 543.7mmol/m3 H2O, 31.5C, 99.6kPa, 96.2SS 0035 clean read: 433.1ppm CO2, 497.9mmol/m3 H2O, 30.7C, 99.6kPa, 99.1SS 0073 fresh read: 439.7ppm CO2, 476.5mmol/m3 H2O, 31.7C, 99.6kPa, 97.8SS I checked on the tipping bucket that hasn't recorded rain recently. There was a broken pin on the plug at the data logger. I couldn't get the broken piece out of the screw terminal but was able to put the wires back in without the plug. There are ten or so bogus tips from testing in the data. I also checked on the reflected PAR. In the data it seemed low so I setup a second sensor sn 030382 on 6H, 6L of the CR1000. After I downloaded the data I updated the CR1000 program for this second reflected PAR and it read about the same as the original one in mV. Maybe the grass is just sucking down that much more PAR right now. Anyway, I'll let it run for a couple weeks. We went to the pond. All seemed well there I forgot to check the staff gauge reading. Kuno put his YSI sonde in the water and got pH and O2 about 8 and 12 respectively. We left at about 16:30 PDT |
Field Data
No tank data
No VR Well data found
No TZ Moisture Point data found
No VR Moisture Point data found
No TZ grass heigth found
No VR grass heigth found
No VR Tree DBH found
No water potential data found
No VR Grass Biomass data found
No VR OakLeaves Biomass data found
No VR PineNeedles Biomass data found
2 photos found
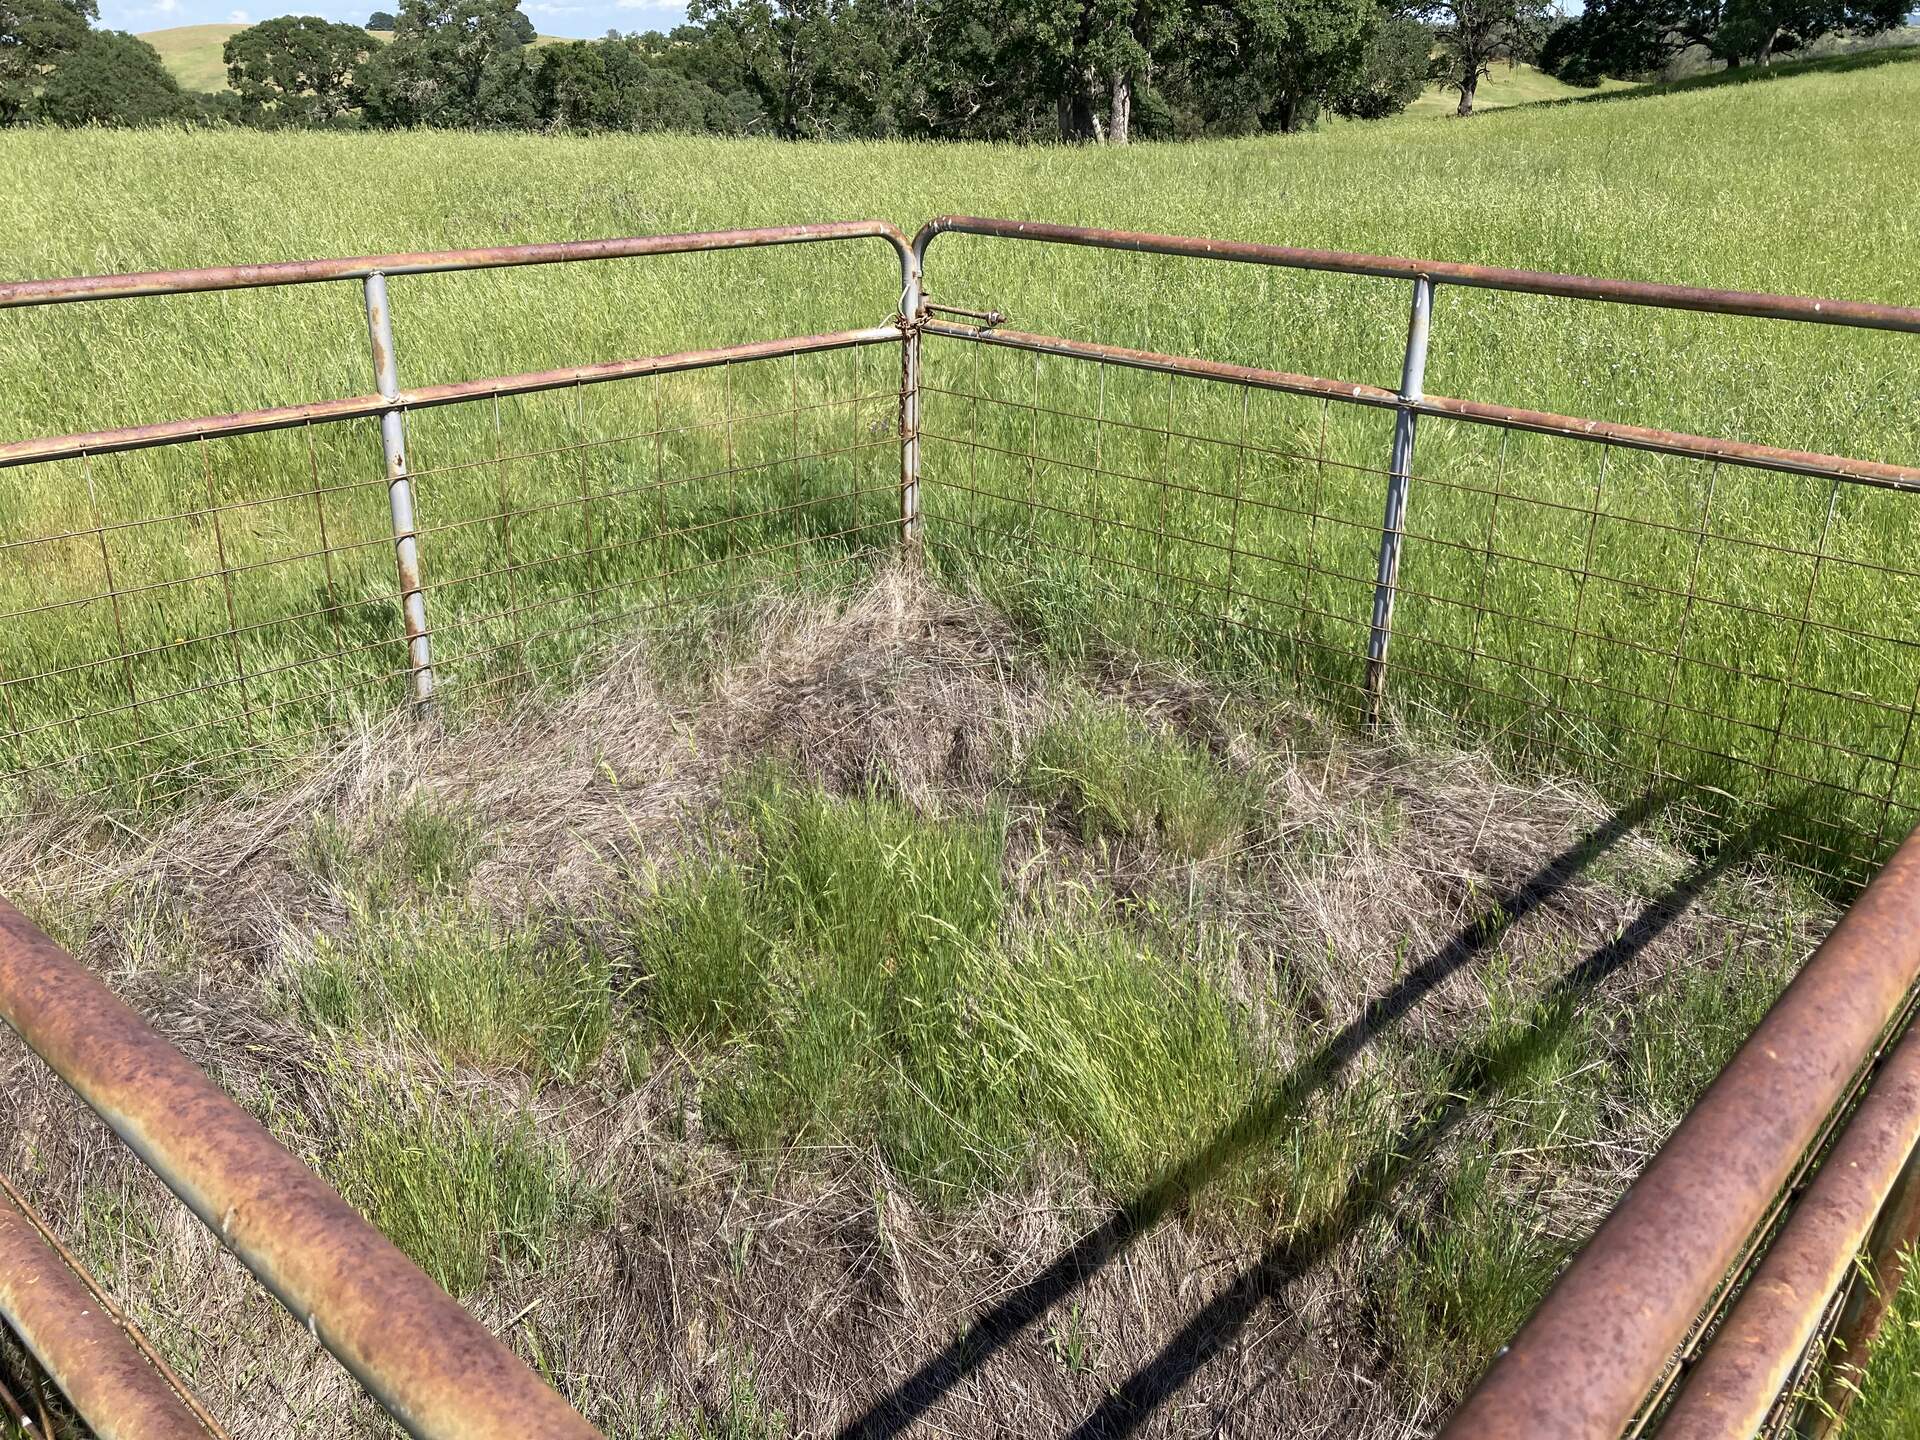
20250429VR_GrazedUngrazed.jpg ( 2025-04-29 15:35:57 ) Full size: 1920x1440
Grass growth in ungrazed and grazed pasture
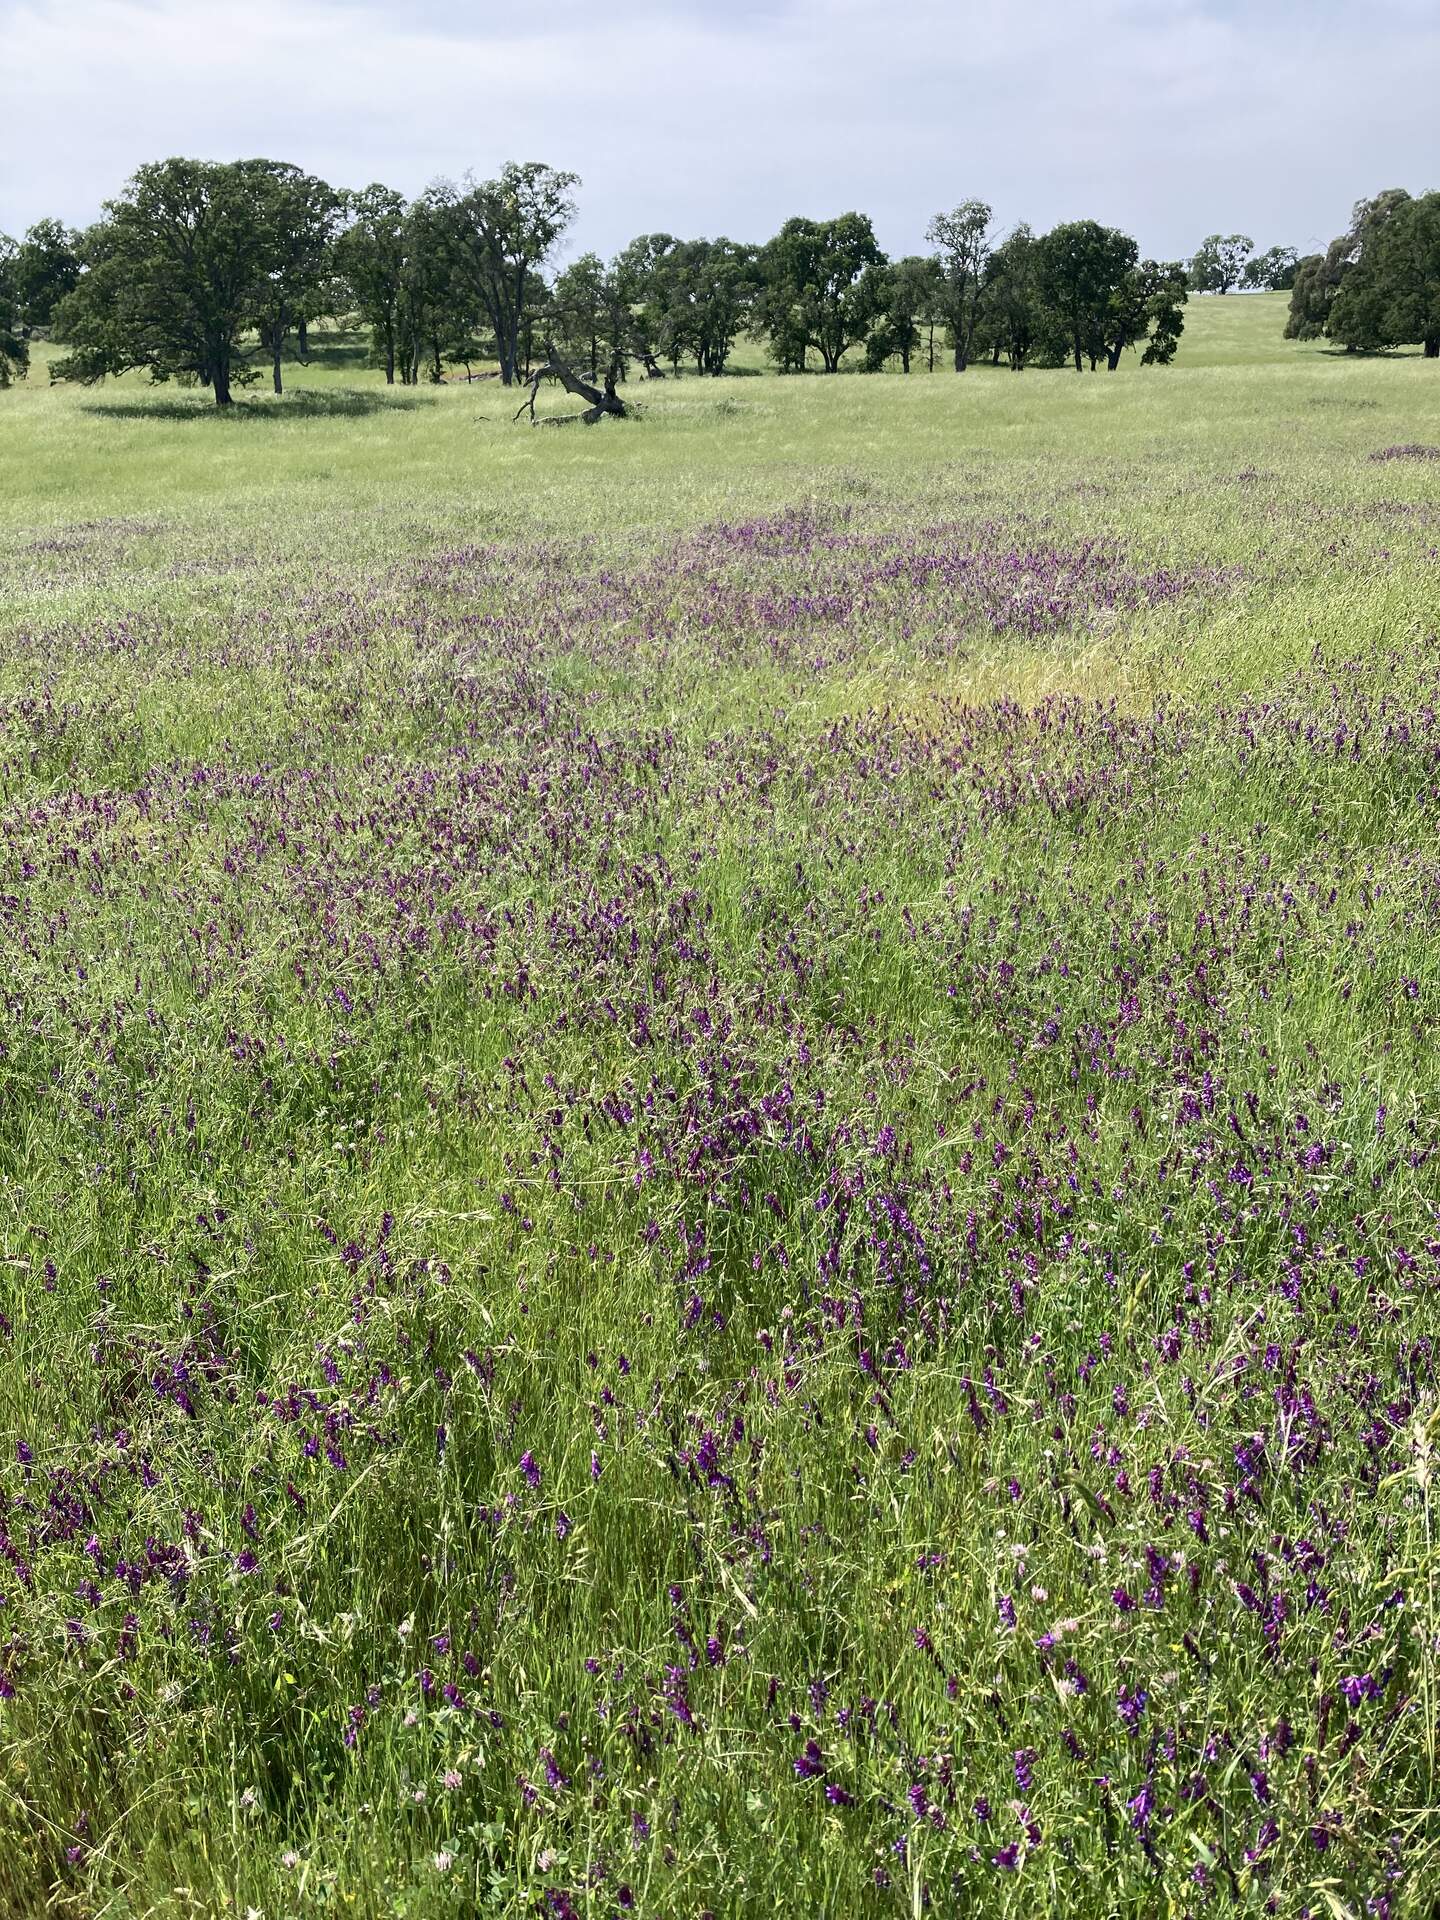
20250429VR_Vetch.jpg ( 2025-04-29 15:32:48 ) Full size: 1440x1920
Vetch flowering in the Vaira pasture
9 sets found
16 VR_met graphs found
2 VR_flux graphs found
No data found for VR_soilco2.
2 VR_pond graphs found
Can't check TZVR_mixed
3 VR_fd graphs found
No data found for VR_processed.
4 VR_arable graphs found
6 VR_soilvue graphs found