Field Notes
<--2014-10-02 11:30:00 | 2014-10-16 12:45:00-->Other sites visited today: Twitchell Rice | East End | West Pond | Sherman Island | Mayberry
Phenocam link: Searching...
Twitchell Alfalfa: 2014-10-09 09:00:00 (DOY 282)
Author: Joe Verfaillie
Others: Patty
Summary: Reinstalled soil collar 1, swapped FD probe, swapped sonic cable, Many slightly chewed cables.
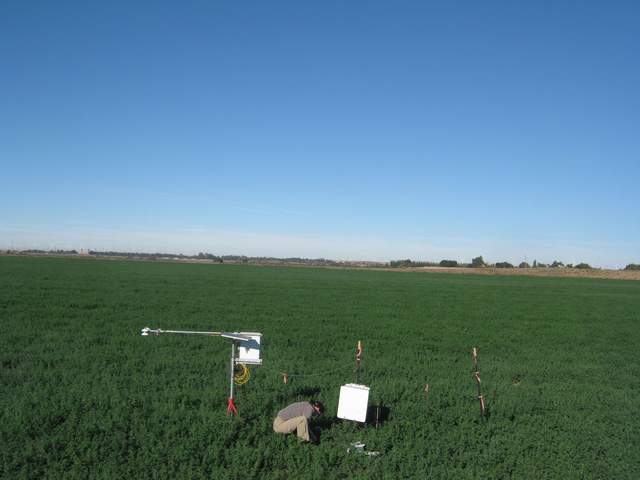
| Alfalfa 2014-10-09 I arrived about 9:00 with Patty. It was clear, sunny and cool with a nice breeze. The alfalfa is green and getting tall again. The road to the south has puddles and the ditch to the tower is soggy. I drove on the alfalfa along the edge of the field up to the ditch and then we walked in. I almost got the car stuck turning around – Patty pushed the car out- she's super strong. Patty reinstall soil collar 1 in front of profile A and did soil respiration with the 6400. Collar 1: 4.2 (disturbed), Collar 2: 3.9, Collar3: 5.6, Collar 4: 6.0, Collar 5: 4.9, Collar 6: 4.7 She checked on the FD Air probe that was still reading high. She removed sn Z2720014 and installed sn Z2720011 and the readings were better around 19mV. The other soil CO2 readings were okay as well as the radiation sensors. There were wasps in the radiation box. Most of the wasps left before I sealed the holes in the bottom and closed a few in. I swapped the sonic cable at the tower. All data was okay after the swap. 7500 read: 406ppm CO2, 672 mmol/m3 H2O, 81.9 SS, 22.59C, 101.22kPa Many of the cables at the tower were chewed to different degrees. Walking to the tower I noticed many ground squirrel holes. Seems the squirrel population is growing. I reran most of the wires at the tower keep them out of reach of the squirrels. But we still should bring some split loom to help protect wires next time. I also reburied some wires that were poking out of the soil near the tower. Patty did veg height and spectral measurements and washed the solar panels. |
Veg Height (cm): Tape measure from ground to top of plant
33, 33, 33, 52, 40, 39, 30, 35, 30, 49, 47, 39, 45, 36, 52, 50, 43, 50, 54, 50, avg = 42, stdev = 8.14
1 photos found

TA_autocam_20141009_0815.jpg ( 2014-10-09 08:15:03 ) Full size: 1920x1440
Patty on site
7 sets found
Can't check TA_met
11 TA_met graphs found
Can't check TA_rad
3 TA_rad graphs found
Can't check TA_flux
5 TA_flux graphs found
Can't check TA_soilco2
7 TA_soilco2 graphs found
No data found for TA_arable.
1 TA_cam graphs found
Can't check TATWBABCSB_cam

