Field Notes
<--2014-10-02 14:05:00 | 2014-10-16 14:00:00-->Other sites visited today: Twitchell Alfalfa | Twitchell Rice | East End | West Pond | Mayberry
Phenocam link: Searching...
Sherman Island: 2014-10-09 13:00:00 (DOY 282)
Author: Joe Verfaillie
Others: Patty
Summary: Set up Loggernet data collection, collected autocam, wasps in the box - sealed, tipping bucket tested and adjusted, UC Davis on site.
| Sherman 2014-10-09 I arrived about 1:00pm with Patty. It was clear, sunny and warm with a strong breeze. The weeds in the field looked trampled by cows. There was a group from UC Davis there doing inventory measurements. The same folks I saw at Tonzi on Tuesday. The computer wasn’t collecting the met data because Cove had to set up the Loggernet setting last time. I completed the scheduled collection settings and saw the data collected but did not download it. The LGR read: 13:05, 22.49C, 132.5Torr, 14.71usec, 10Hz, 1.883ppm CH4. Pressure was adjusted to 148.5Torr. The 7500 read: 16.2mmol/m3 CO2, 704mmol/m3 H2O, 101.45kPa, 28.17C, 248diag We did a tipping bucket test. This is an inch bucket and the total should have been 25.4mm. The total was 23.876. The difference was 1.524mm at 0.254mm per tip – short by 6 tips. We turned the screws one full turn CW. The data was deleted from the data file. There were a ton of wasps and a huge next in the main CR10X box as Cove reported. I opened the box and many of the wasps dispersed. I discovered they were entering the box through a quarter inch round hole in the bottom – they just barely fit through the hole. I closed the door and plugged the hole with putty. I collected the camera images that were missed last time do to wasp activity. Patty did moisture point, veg height, spectral and well depth measurements. |
Veg Height (cm): Tape measure from ground to top of plant
60, 27, 15, 20, 50, 60, 50, 60, 80, 50, 70, 90, 80, 68, 79, 40, 15, 25, 20, 50, avg = 50.5, stdev = 23.8
1 photos found

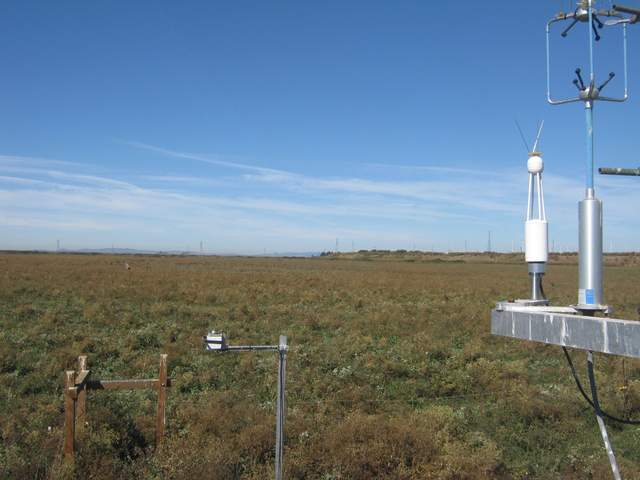
SI_autocam_20141009_1045.jpg ( 2014-10-09 10:45:02 ) Full size: 1920x1440
Someone in the field
7 sets found
No data found for SI_mp.
11 SI_met graphs found
Can't check SI_mixed
2 SI_mixed graphs found
4 SI_flx graphs found
No data found for SI_soilco2.
Can't check TWSI_mixed
Can't check SIMBTWEE_met

