
Field Notes
<--2014-09-25 14:00:00 | 2014-10-09 09:00:00-->Other sites visited today: Sherman Island | Mayberry | Twitchell Rice | East End | West Pond | Tonzi
Phenocam link: Searching...
Twitchell Alfalfa: 2014-10-02 11:30:00 (DOY 275)
Author: Cove Sturtevant
Others: Sara
Summary: Regular fieldwork. Ditches full of water. Updated 7500 firmware. Tested out new spectral.
| Twitchell Alfalfa 2014-10-02 We arrived at about 11:30 PDT. It was hot and sunny already, with a light breeze from the north. Ditch and road leading to alfalfa were full of water. Sara did spectral and clip plots while I downloaded data, did veg height, and updated the 7500 firmware to 7.3.0. Sara was going to compare the old and new spectral but couldn’t get the old one to work. New one appears very easy and quick to use. No soil respiration today, trek to car was a long one and we forgot to bring it after two trips. 7500 readings: CO2 = 408 ppm (same after cleaning) H2O = 455 mmol m-3 (same after cleaning) signal strength = 82.19% (83.2% after cleaning) p = 101.6 kPa t = 25.8 C sos = 348.2 m s-1 Rad good. Soil Co2 profiles and forced diffusion readings looked great. There was new bird poop on the sonic base. This may explain the midday dropouts in the sonic data that I have been seeing. Bird spikes looked fine. |
Veg Height (cm): Tape measure from ground to top of plant
31, 31, 37, 23, 32, 22, 28, 23, 34, 29, 31, 15, 19, 34, 33, 10, 37, 10, 29, 26, avg = 26.7, stdev = 8.14
1 photos found
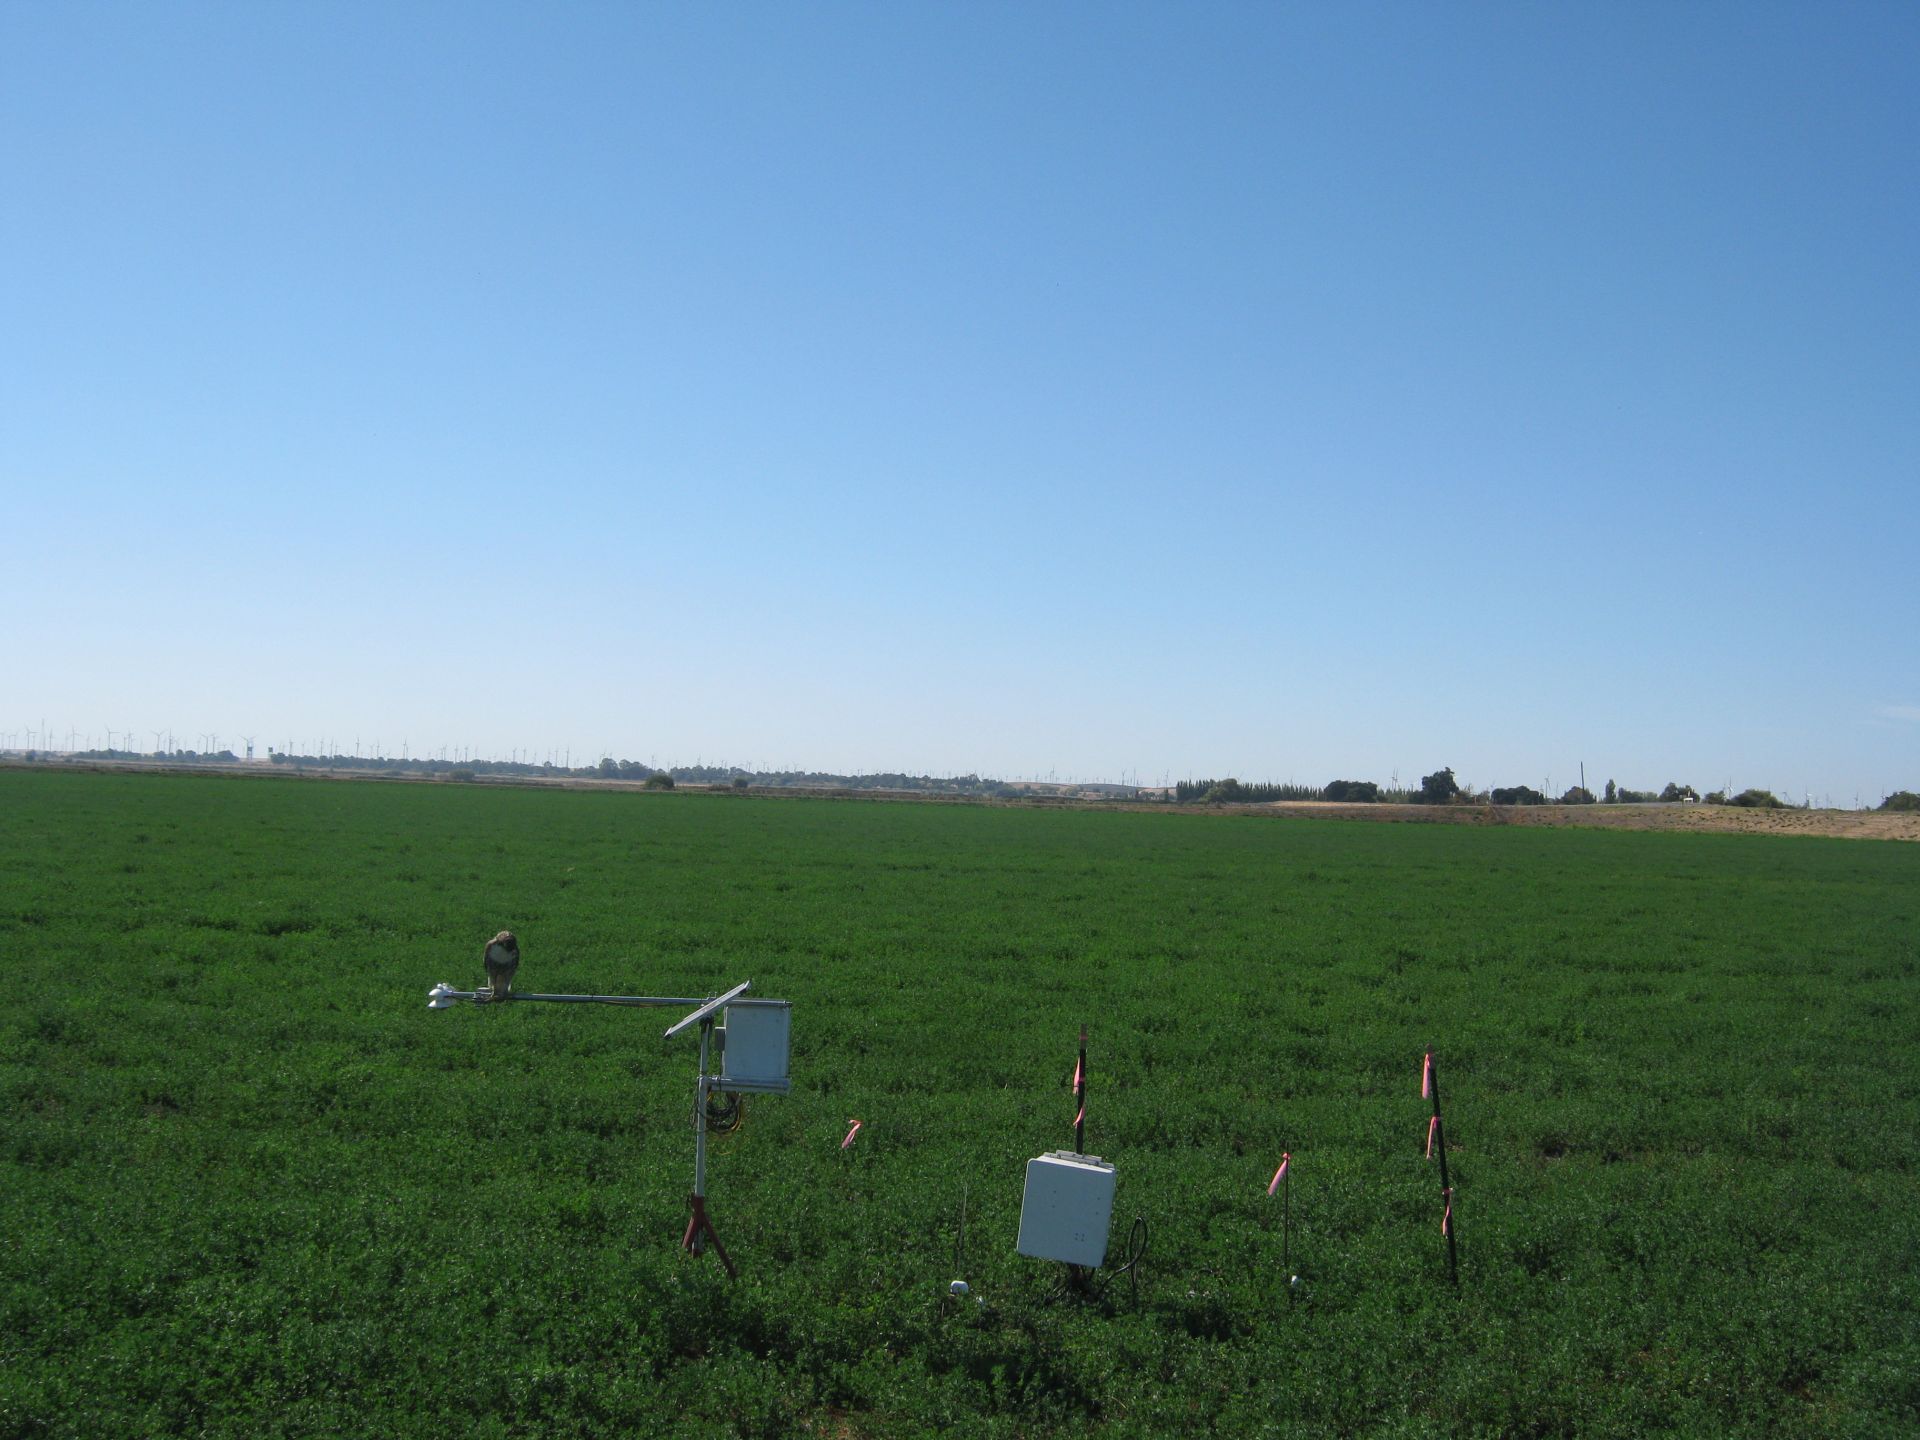
TA_autocam_20141003_1415.jpg ( 2014-10-03 14:15:02 ) Full size: 1920x1440
Hawk on radiation boom
7 sets found
Can't check TA_met
11 TA_met graphs found
Can't check TA_rad
3 TA_rad graphs found
Can't check TA_flux
5 TA_flux graphs found
Can't check TA_soilco2
7 TA_soilco2 graphs found
No data found for TA_arable.
1 TA_cam graphs found
Can't check TATWBABCSB_cam