Field Notes
<--2014-08-27 14:50:00 | 2014-09-08 13:30:00-->Other sites visited today: Sherman Island | Mayberry | Twitchell Rice | East End | West Pond
Phenocam link: Searching...
Twitchell Alfalfa: 2014-09-04 11:45:00 (DOY 247)
Author: Joe Verfaillie
Others: Patty
Summary: took soil samples, added power line for 6400, standard field work, fixed soilco2 power issue, FD sensors reading low, reset data logger clocks by a few minutes.
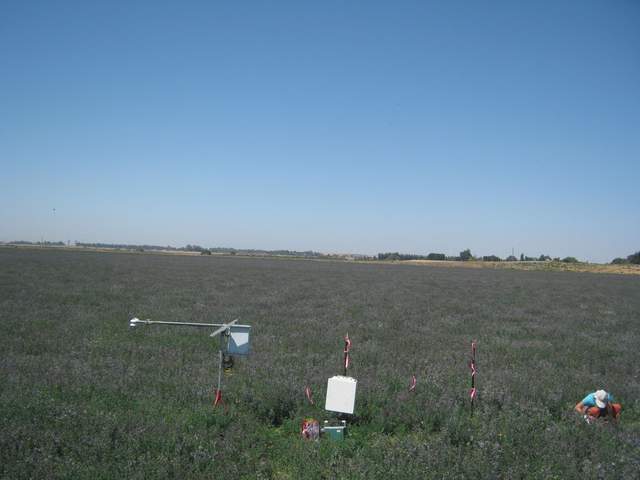
| Alfalfa 2014-09-04 I arrived about 11:45 with Patty. The field is thick with flowers and very happy bees. The ditch along the road to the south was full of water. Patty dug a pit and took soil samples for bulk and particle density. She took five pairs of samples at two depths centered a 4 and 12cm. I took two samples with the slide hammer that seemed to be a bit denser than the ones Patty took. I connected a wire to one of the car batteries to supply power for the LI6400. The wire is coiled up under the logger box ready for next time. The soil CO2 system was okay, but the Forced Diffusion probes were reading low. I discovered that I had failed to switch the power supply line over to the new 24V bus. I fixed this mistake, but there seemed to be no change in the readings from any of the Vaisala probes. Patty did 6400 measurements, veg height, spectra and LAI measurements. I downloaded data from the tower. The 7500 read 390ppm CO2, 650mmol/m3 H2O, 92.3SS, 100.52kPa, 28.46C In the data I noticed that the radiation system seems to be losing power at night. The solar panel was very dirty and I cleaned it. But now that I have run a power line out there, maybe I should use it to supply power to the radiation system. The main solar panels were very dirty too and were cleaned. The clocks on the various data logger with a little off and were reset: CR1000: +2min 7500: -4min CR10x-rad: -3min CR10x-soilco2 – okay. |
Veg Height (cm): Tape measure from ground to top of plant - Flowering
60, 58, 48, 50, 57, 60, 60, 58, 44, 66, 54, 50, 48, 47, 74, 47, 60, 68, 55, 56, avg = 56, stdev = 7.79
1 photos found

TA_autocam_20140904_1115.jpg ( 2014-09-04 11:15:03 ) Full size: 1920x1440
Fieldwork
7 sets found
Can't check TA_met
11 TA_met graphs found
Can't check TA_rad
3 TA_rad graphs found
Can't check TA_flux
5 TA_flux graphs found
Can't check TA_soilco2
7 TA_soilco2 graphs found
No data found for TA_arable.
1 TA_cam graphs found
Can't check TATWBABCSB_cam

