Field Notes
<--2013-09-11 11:40:00 | 2013-10-02 11:15:00-->Other sites visited today: Sherman Island | Mayberry | DWR Corn | Twitchell Alfalfa | West Pond
Phenocam link: Searching...
Twitchell Rice: 2013-09-18 10:10:00 (DOY 261)
Author: Cove Sturtevant
Others: Joe, Laurie
Summary: Pulled ground instruments, rotated radiation boom inward. Corrected autocam view. All good.
| Twitchell Rice 2013-09-18 We arrived about 10:10 PDT. It was windy, sunny, and warm (23 C). We met Jim who was about to test harvest a field (not ours), and if good they would harvest our field. He was waiting for the moisture to drop close to 18% (a field they tested a few days previous was at 20%). Jim said that there is a trade-off between harvesting early and paying extra drying costs (grain is eventually dried down to 14%) vs. harvesting later and losing grain due to bird consumption. Joe and I attended to the tower, pulled all the ground instruments and rotated the radiation boom in while Laurie pulled the transect stakes in the field. I swiveled the autocam view back toward the left. It had somehow drifted to the right and no longer included a view of the flux instruments. [Joe] UC Davis was busy in the fields taking arm loads of rice samples. 7500 readings: CO2 = 386 ppm (same after cleaning) H2O = 440 mmol m-3 (same after cleaning) signal strength = 86.4% (86.9% after cleaning) t = 22.8 C p = 101.7 kPa sos = 347.0 m s-1 7700 readings: CH4 = 1.95 ppm (same after cleaning) RSSI = 37% (73% after cleaning) Reservoir was full. MET data looked good considering ground sensors were coiled under the tower. |
1 photos found

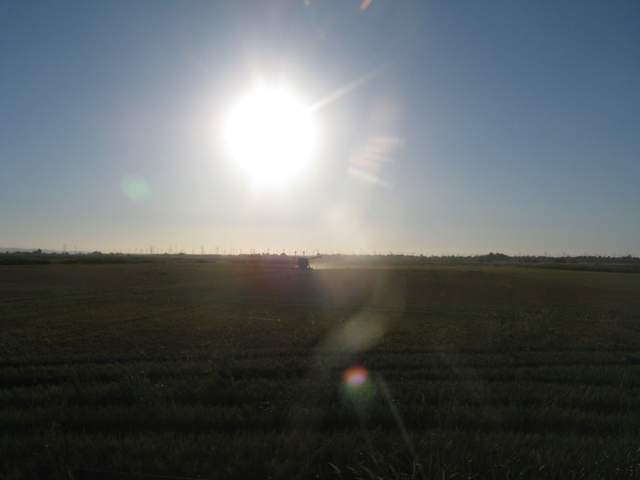
TW_autocam_20130919_1715.jpg ( 2013-09-19 17:15:02 ) Full size: 1920x1440
Start of rice harvest
6 sets found
12 TW_met graphs found
5 TW_flux graphs found
Can't check TWSI_mixed
Can't check SIMBTWEE_met
1 TW_cam graphs found
Can't check TATWBABCSB_cam

