Field Notes

<--2013-09-11 10:30:00 | 2013-10-02 10:15:00-->
Other sites visited today: Sherman Island | Twitchell Rice | DWR Corn | Twitchell Alfalfa | West Pond
Phenocam link: Searching...

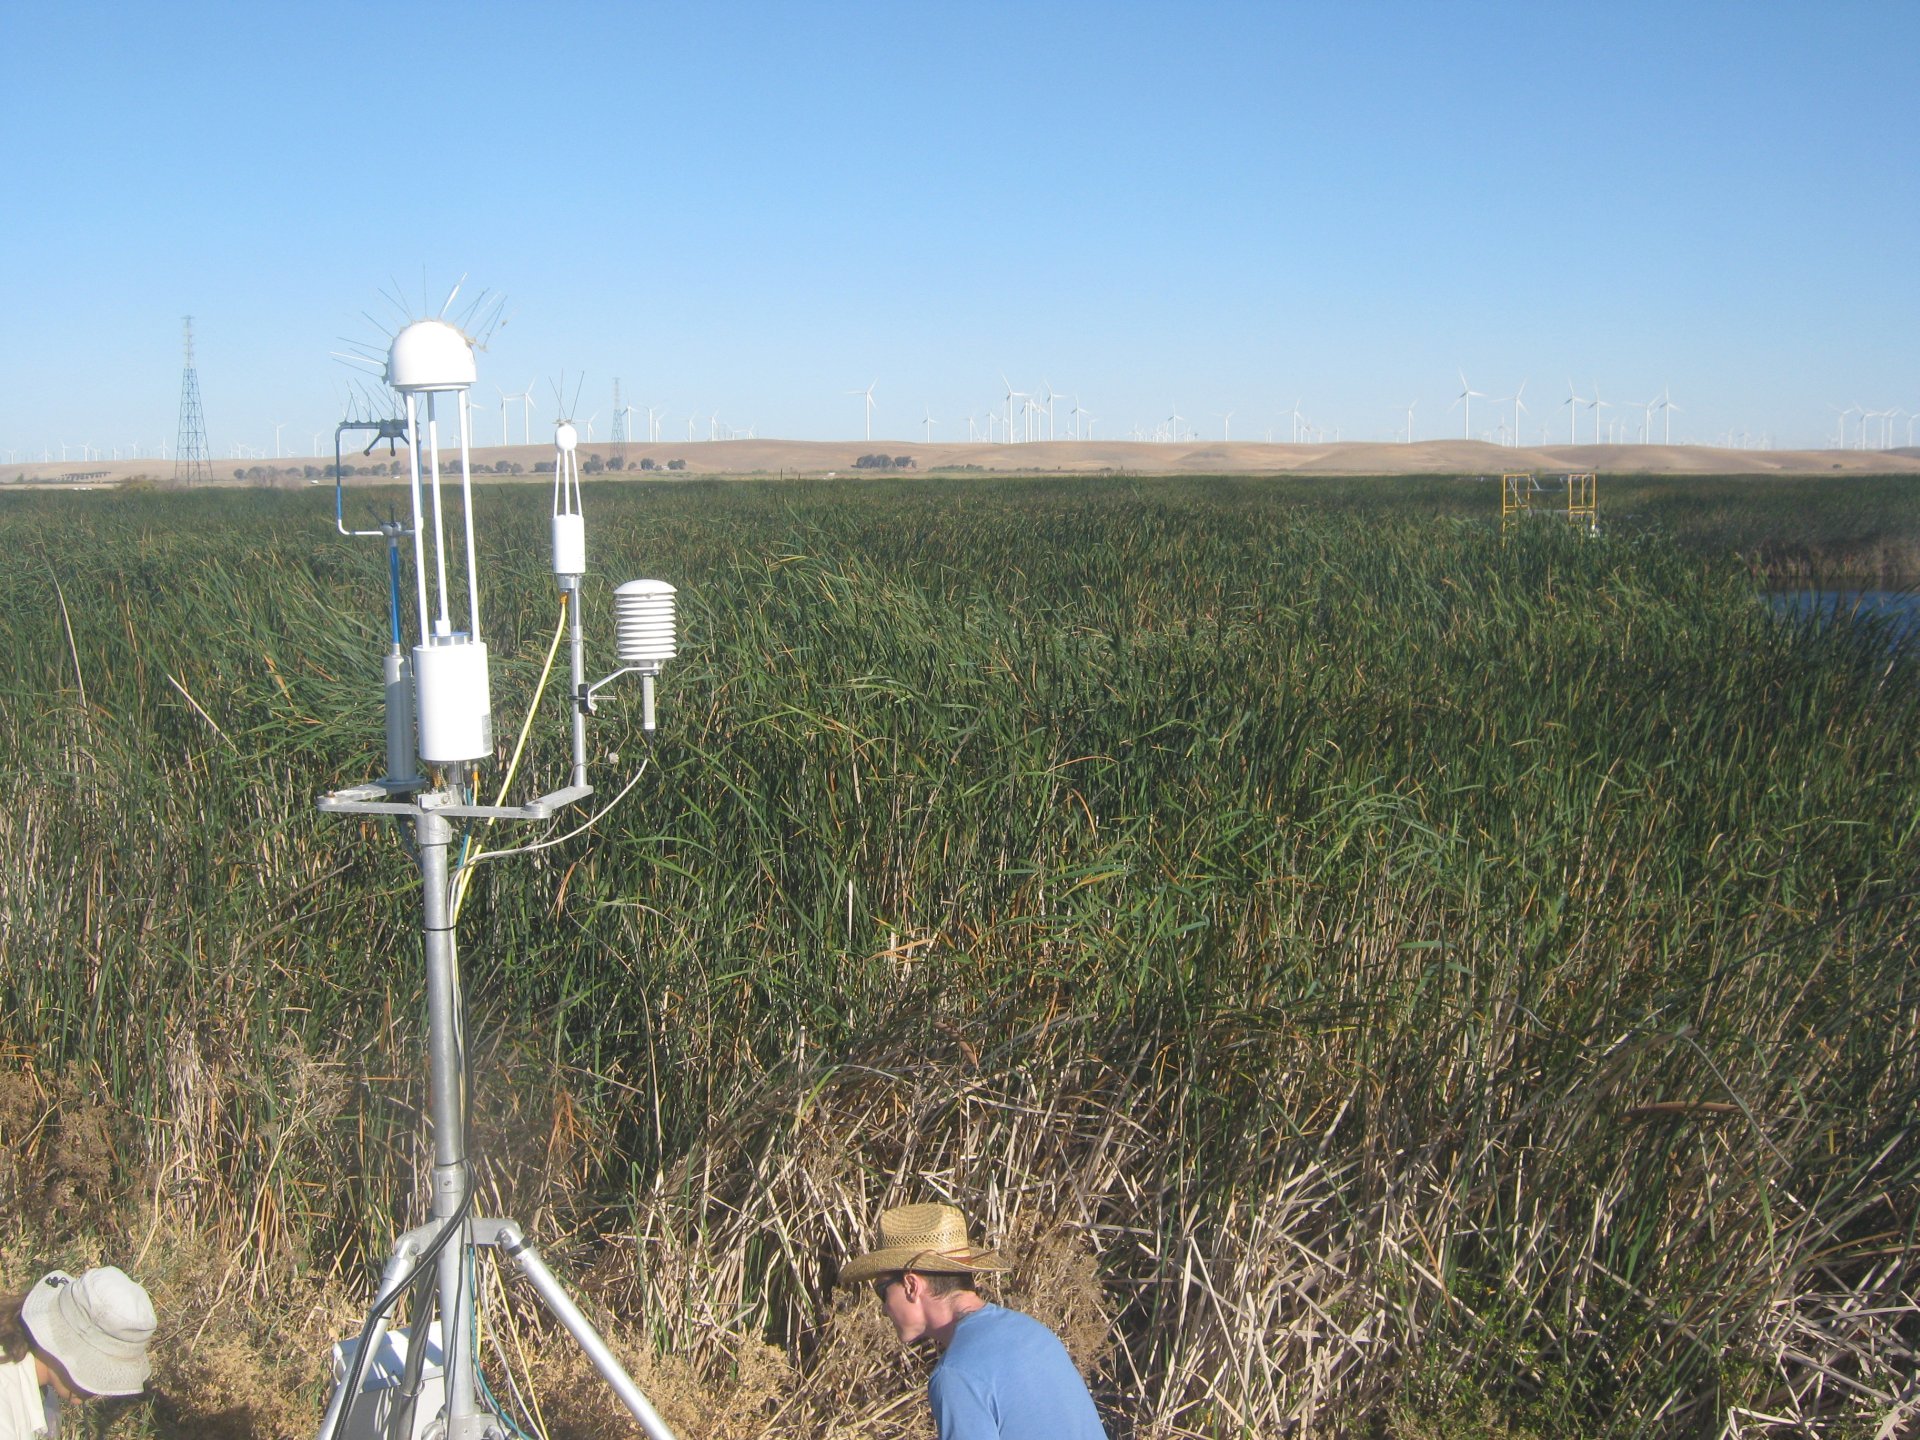
Mayberry: 2013-09-18 09:15:00 (DOY 261)
Author: Cove Sturtevant
Others: Joe, Laurie

Summary: Standard site visit. All A-OK.

Mayberry
2013-09-18

We arrived about 09:15 PDT. It was sunny and warm with an increasing breeze. We forgot the waders so no trip out to the tule tower today. At the flux tower, we found lots of otter prints sliding down the solar panels and they apparently enjoy chewing the solar shielding for the 7700 reservoir tubing. No breaks in the line, though. Joe cleaned the solar panels.

7500 readings:
CO2: 387 ppm (same after cleaning)
H2O: 430 mmol m-3 (same after cleaning)
signal strength = 96.6% (96.9% after cleaning)
t: 21.4 C
p = 101.3 kPa
sos = 345.0 m s-1

Current 7700 readings:
CH4 = 2.0 ppm (same after cleaning)
RSSI = 40% (75 after cleaning)
The reservoir was full.

MET looked good.

1 photos found

Site visit
MB_autocam_20130918_0915.jpg ( 2013-09-18 09:15:02 ) Full size: 1920x1440
Site visit

Graphs display:
11 sets found

7 MB_flux graphs found

Explore the graph:Sonic Wind in a new window

Explore the graph:LI7700 mV signals in a new window

Explore the graph:Counts in a new window

Explore the graph:LI7700 CH4 from analog signal in a new window

Explore the graph:LI7500 CO2 and H2O in a new window

Explore the graph:LI7700 CH4 from digital signal in a new window

Explore the graph:CO2 in ppm in a new window

No data found for MB_met.
28 MB_tule graphs found

Explore the graph:MB Tule Tower: Open Water 2 (3/1/11-3/23/17) in a new window

Explore the graph:MB Tule Tower: Open Water 1 (3/1/11-2/21/13) in a new window

Explore the graph:MB Tule Tower: Tule Temps 2 & 3 (3/1/11-3/19/14) in a new window

Explore the graph:MB Tule Tower: Tule Temps 1 (3/1/11-3/19/14) in a new window

Explore the graph:Mayberry Tule Tower: Solar Radiation in a new window

Explore the graph:Mayberry Tule Tower: Disolved Oxygen in a new window

Explore the graph:Mayberry Tule Tower: IRT and Sensor Temp in a new window

Explore the graph:Mayberry Tule Tower: Volts and RH in a new window

Explore the graph:LED NDVI Sensor in a new window

Explore the graph:Water CO2 in a new window

Explore the graph:Water Pressure in a new window

Explore the graph:Fluorometer Data in a new window

Explore the graph:Mayberry pCO2 Profile in a new window

Explore the graph:Water Temperatures in a new window

Explore the graph:Air Temperatures in a new window

Explore the graph:Air Pressure in a new window

Explore the graph:4-Way Radiometer in a new window

Explore the graph:MB Tule Tower: Open Water 1 (2/21/13-3/19/14) in a new window

Explore the graph:MB Tule Tower: Tule Temps 1 (3/19/14-now) in a new window

Explore the graph:MB Tule Tower: Open Water 1 (3/19/14-now) in a new window

Explore the graph:MB Tule Tower: Tule Temps 2 & 3 (3/19/14-3/23/17) in a new window

Explore the graph:MB Tule Tower: Tule Temps 2 (3/23/17-now) in a new window

Explore the graph:MB Tule Tower: Tule Temps 3 (3/23/17-now) in a new window

Explore the graph:SRS NDVI Channels in a new window

Explore the graph:SRS NDVI in a new window

Explore the graph:Net Radiation in a new window

Explore the graph:Conductivity in a new window

Explore the graph:Soil electrical conductivity in a new window

Can't check MBWPEESWGT_mixed
1 MB_cam graphs found

Explore the graph:Mayberry Autocam GCC in a new window

Can't check MBEEWPSWEPGT_cam
Can't check SIMBTWEE_met
No data found for MB_minidot.
Can't check MBSWEEWPBCBA
1 MB_processed graphs found

Explore the graph:Mayberry processed CO2 Fluxes in a new window

Can't check MB_fd
1 MB_fd graphs found

Explore the graph:Water Forced Diffusion CO2 Flux in a new window