
Field Notes
<--2013-06-27 11:15:00 | 2013-07-16 12:20:00-->Other sites visited today: Sherman Island | Mayberry | Twitchell Rice | Twitchell Alfalfa | DWR Corn
Phenocam link: Searching...
West Pond: 2013-07-10 12:30:00 (DOY 191)
Author: Joe Verfaillie
Others: Laurie, Yanel, Cristina
Summary: Inlets running but no water under scaffolding, east pond very low too, ants infestation improving, measured sensor locations
| West Pond 2013-07-10 I arrived about 12:30 with Laurie, Yanel and Cristina. It was clean and hot with a light breeze from the northwest. The water inlet was running but there was no water under the tower scaffolding and the East Pond water level was about a half meter below the boardwalk. The ants were still poking about the 7550 box. I removed all the baits and used some canned air to blow the ants and all the debris out of the boxes. Just before leaving I blew a few more ants out and replaced the baits before closing it up. The 7500 read: 381ppm CO2, 677mmol/m3 H2O, 86% SS, 28.96C, 100.94kPa The 7700 read 1.96ppm CH4, 35.2 RSSI rising to 70 after cleaning We measured the heights of some of the instruments and I took a photo with ruled square to get lateral positions. In the folded position the center of the eddy sensors is 4.7 meters above the muck. The soil temp sticks are 48 inches long and we measured the height of the top of the stick above the muck. The stick near the entrance to the scaffolding is 45cm agl, and the stick near the well is 59cm agl. The top of the well pipe is 76cm agl. Lateral distances between the eddy sensors are Sonic to 7700 36cm Sonic to 7500 20cm Sonic to HMP60 100cm No water samples - no water. |
2 photos found
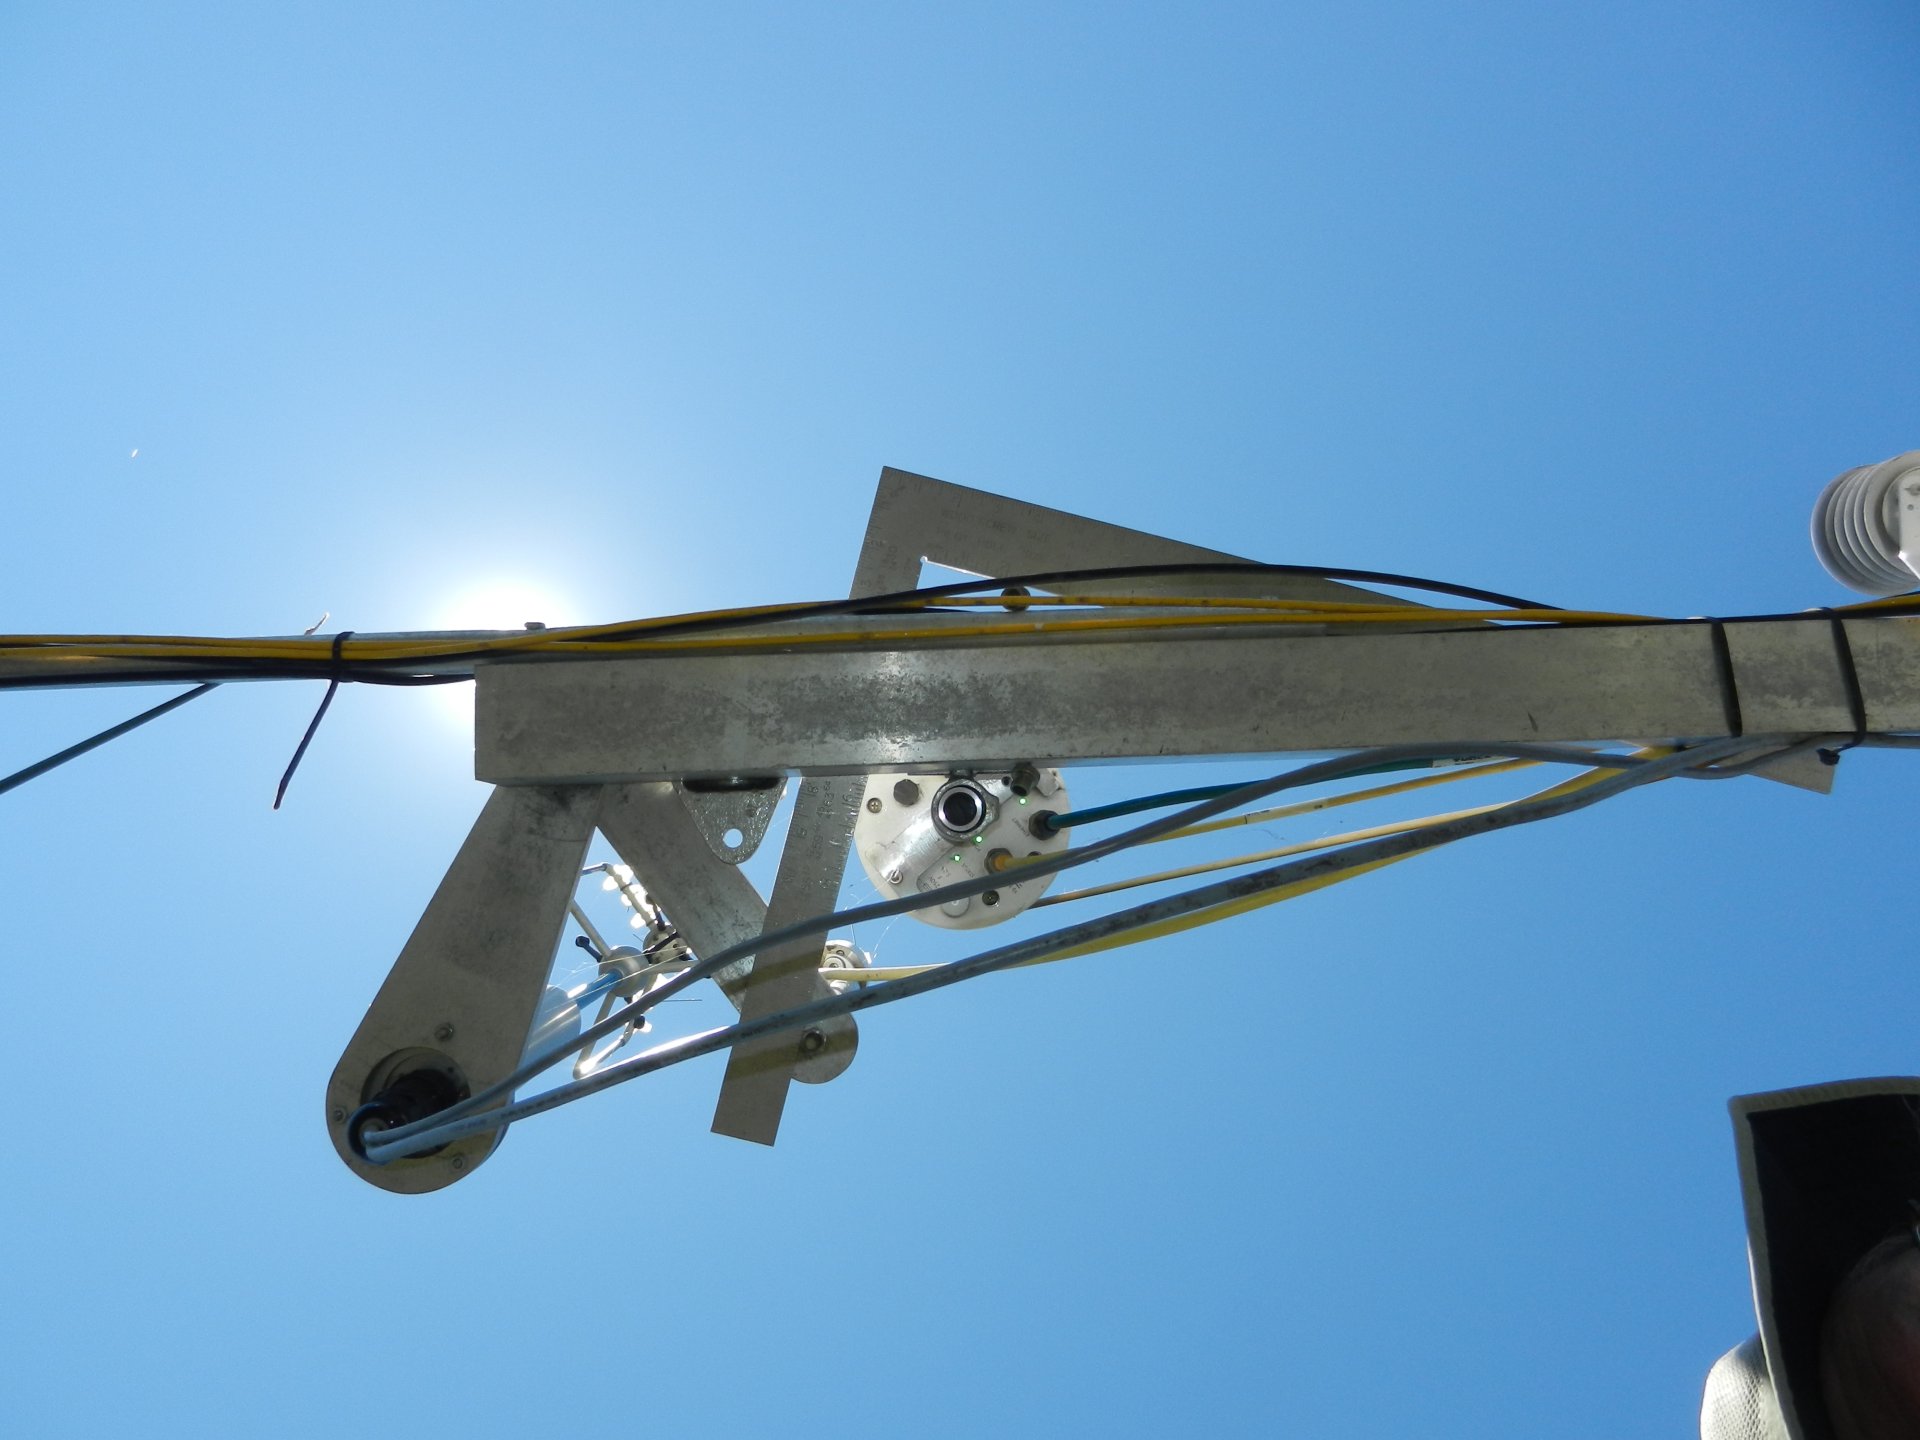
20130710WP_EddyPositions.jpg ( 2013-07-10 13:10:32 ) Full size: 1920x1440
Position of the eddy sensors

WP_autocam_20130711_1845.jpg ( 2013-07-11 18:45:03 ) Full size: 1920x1440
Spider web
8 sets found
Can't check WP_DO
1 WP_DO graphs found
14 WP_met graphs found
5 WP_flux graphs found
Can't check MBWPEESWGT_mixed
Can't check MBEEWPSWEPGT_cam
Can't check MBSWEEWPBCBA
1 WP_processed graphs found
No data found for WP_arable.