
Field Notes
<--2013-06-27 08:25:00 | 2013-07-16 09:00:00-->Other sites visited today: Mayberry | Twitchell Rice | West Pond | Twitchell Alfalfa | DWR Corn
Phenocam link: Searching...
Sherman Island: 2013-07-10 08:30:00 (DOY 191)
Author: Joe Verfaillie
Others: Laurie, Yanel, Cristina
Summary: Standard fieldwork, data collection, soil respiration, checked LGR cal, measured sensor positions, hmp45 fan off - fixed.
| Sherman 2013-07-10 I arrived about 8:30 with Laurie, Yanel and Cristina. It was clear, cool and windy from the west. I havent been to the site since May 15th. The cattails in the ditch near the road have grown a lot. The water level under the bridge was low but the north side of the field looked wet. The pepper weed is declining but will probably perk up again before the winter. When we arrived the LGR read: 8:31, 25.47C, 139.60Torr, 12.610usec, 10Hz, 1.882ppm I switched into slow flow mode and pressure was 156.17Torr. I ran the cal gas from the tank on site (1.976ppm CH4 at 500psi) and the LGR was right on, so I did not calibrate. After returning to high flow the pressure was 143.6Torr and I reset it to 10Hz. The LI7500 read: 16.35mmol/m3 CO2, 665mmol/m3 H2O, 101.3kPa, 21.21C, 248 Diag I collected all data and photos. A wire was broken on the HMP45 Fan, I fixed it and the fan was running. The tipping bucket screen had come out and was lying on the ground. I clean some bird poop out of the tipper and replaced the screen. The others did the standard field work including soil respiration. I measured the position of the instruments. I took photos of the instrument position with a ruled square to hopefully measure north-south, east-west separations. The booms on the tower are aligned with magnetic west and north. Heights to centers follow: HMP45 260cm agl CH4 inlet 307cm agl Sonic 316cm agl LI-7500 281cm agl PAR in 268cm agl PAR out 242cm agl CNR1 255cm agl Rnet-Lite 255cm agl LED sensor 255cm agl Tipping bucket 255cm agl (top edge) |
4 photos found
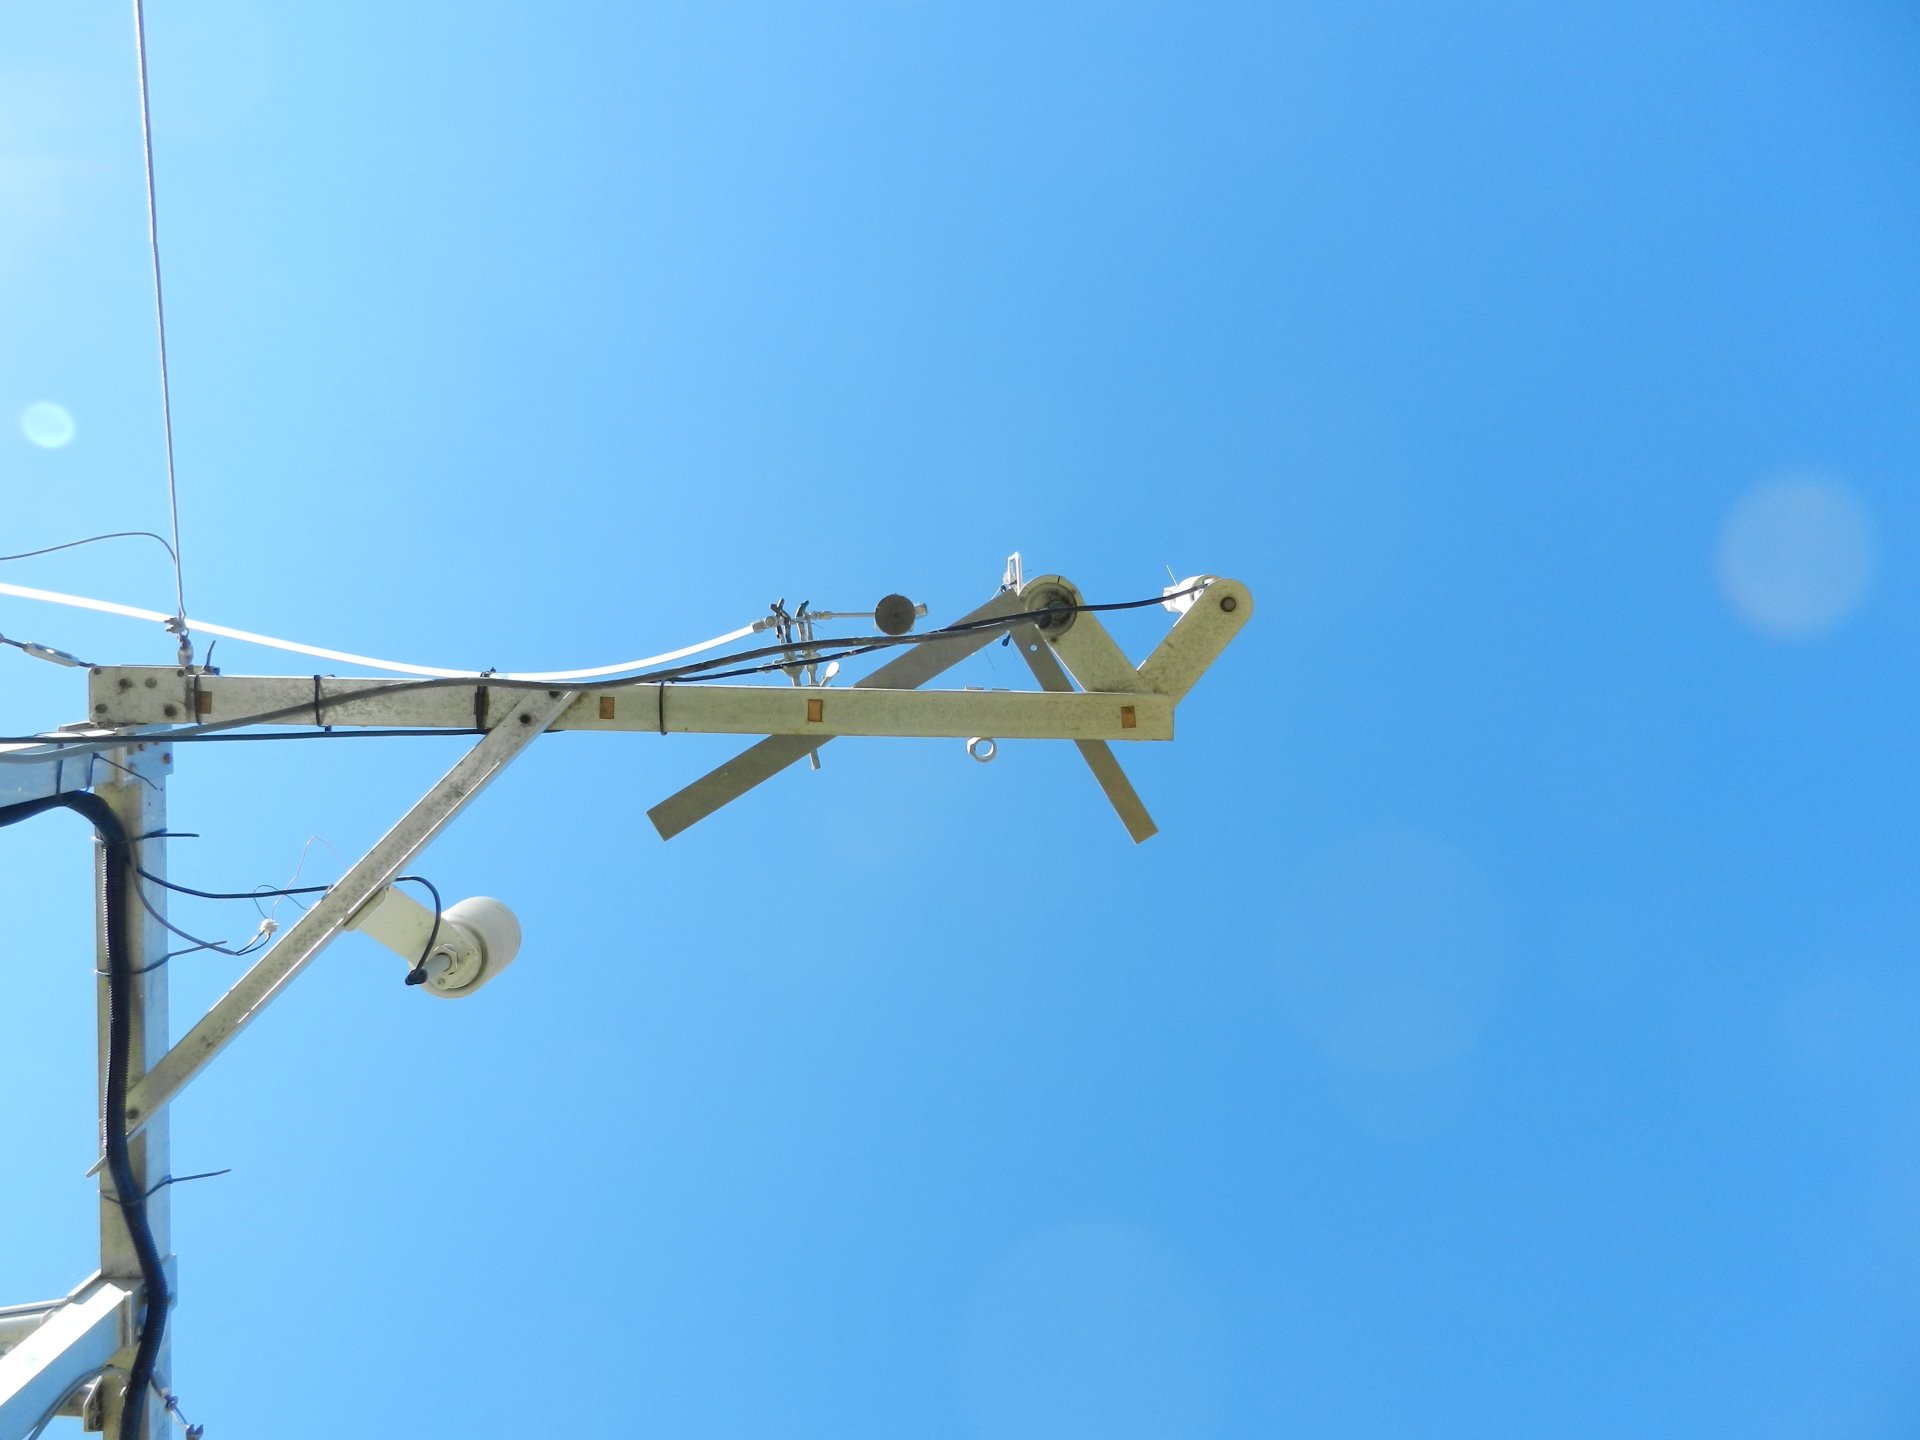
20130710SI_EddyPositions.jpg ( 2013-07-10 09:17:31 ) Full size: 1920x1440
Position of the eddy sensors
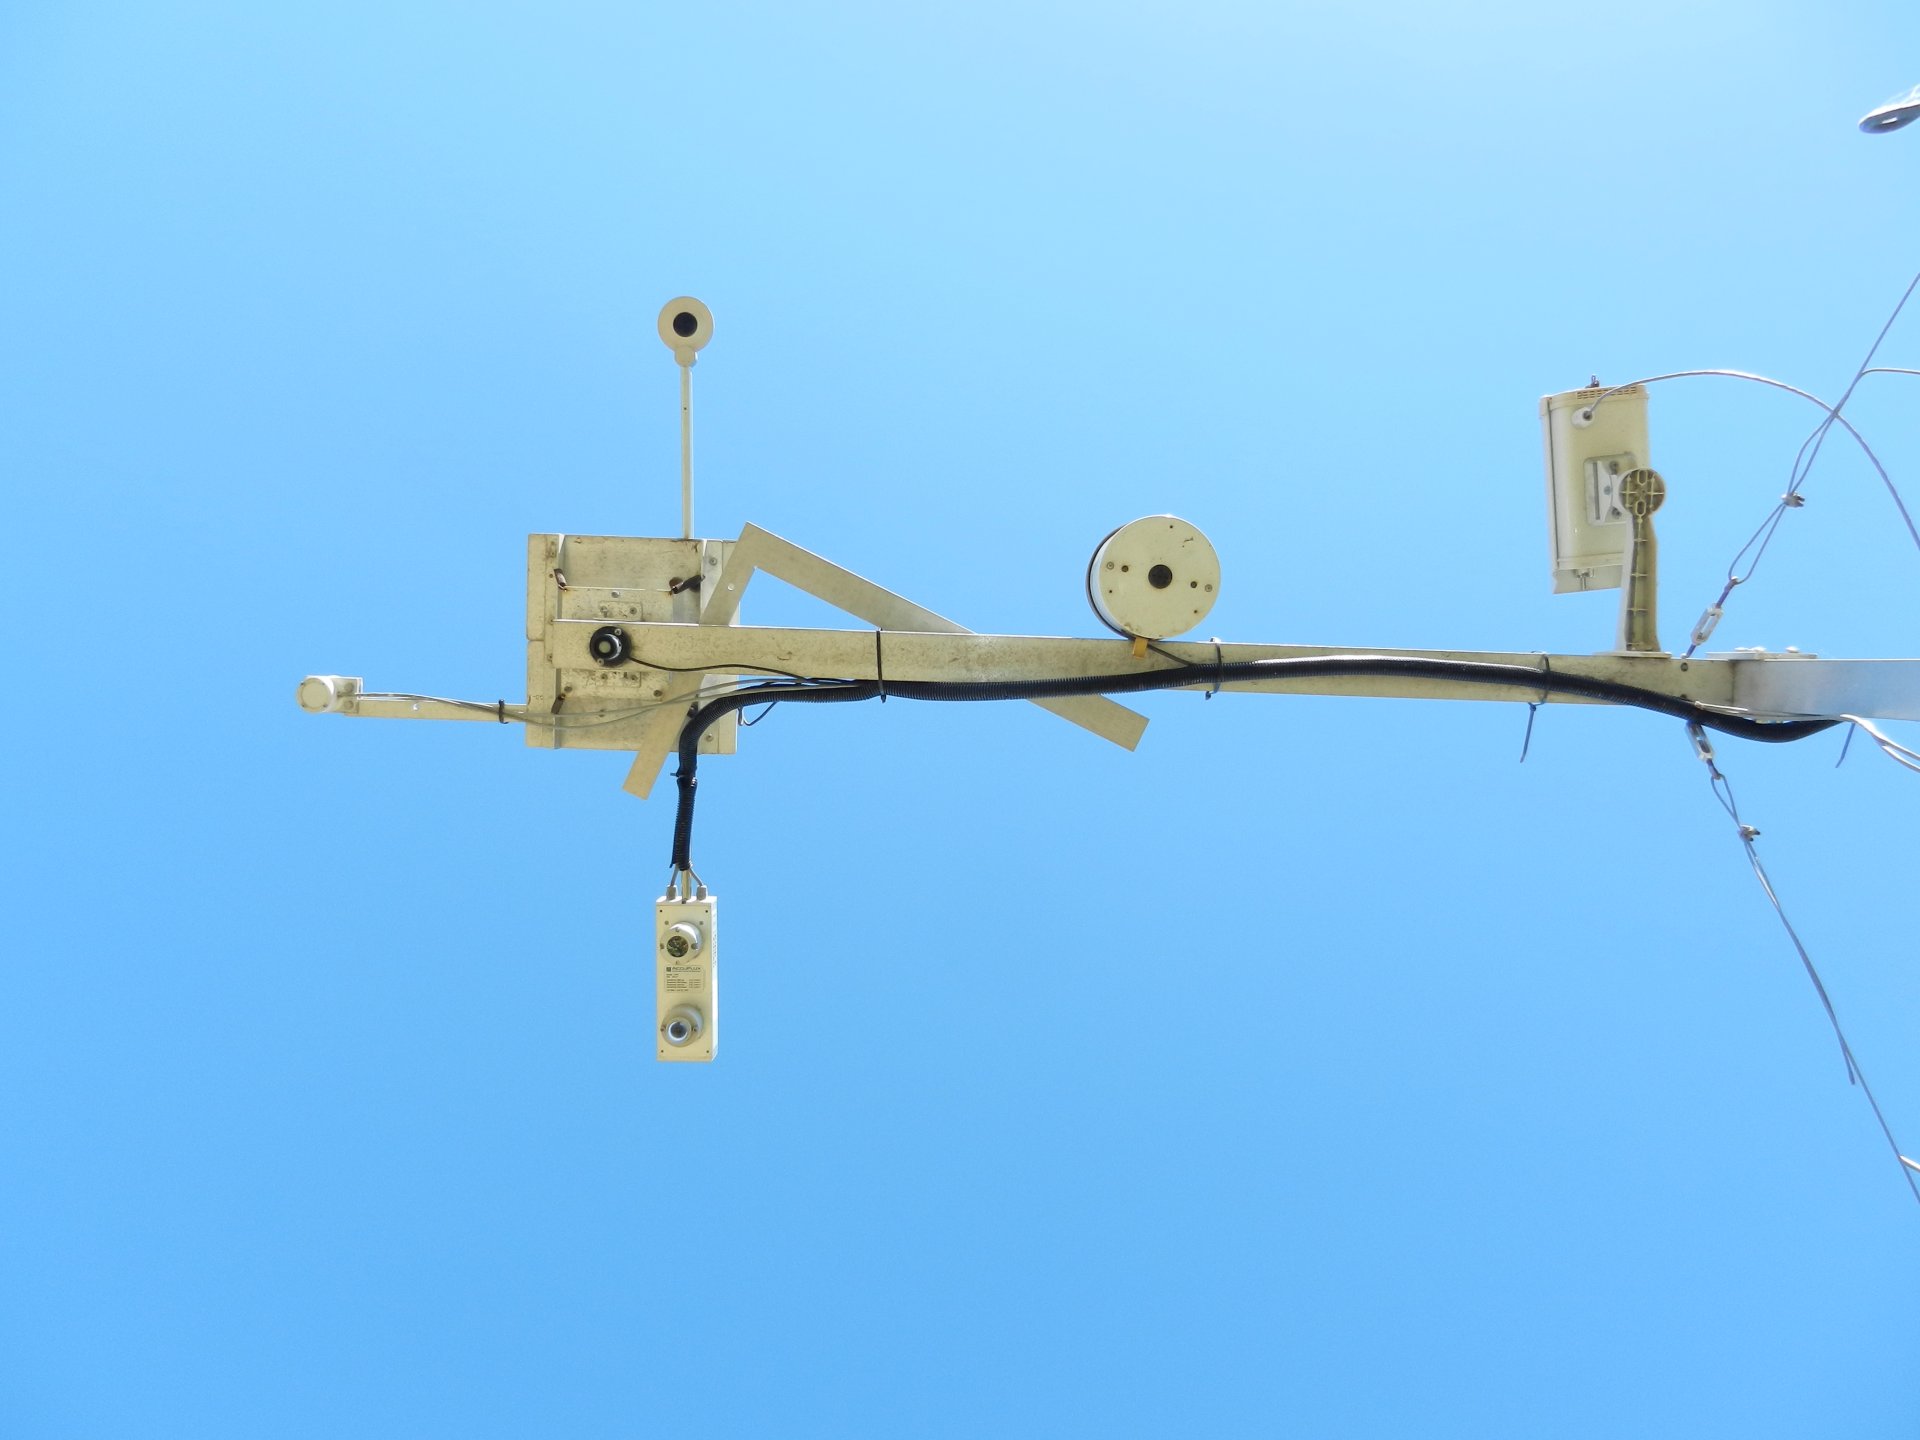
20130710SI_RadPositions.jpg ( 2013-07-10 09:30:13 ) Full size: 1920x1440
Position of the solar radiation sensors
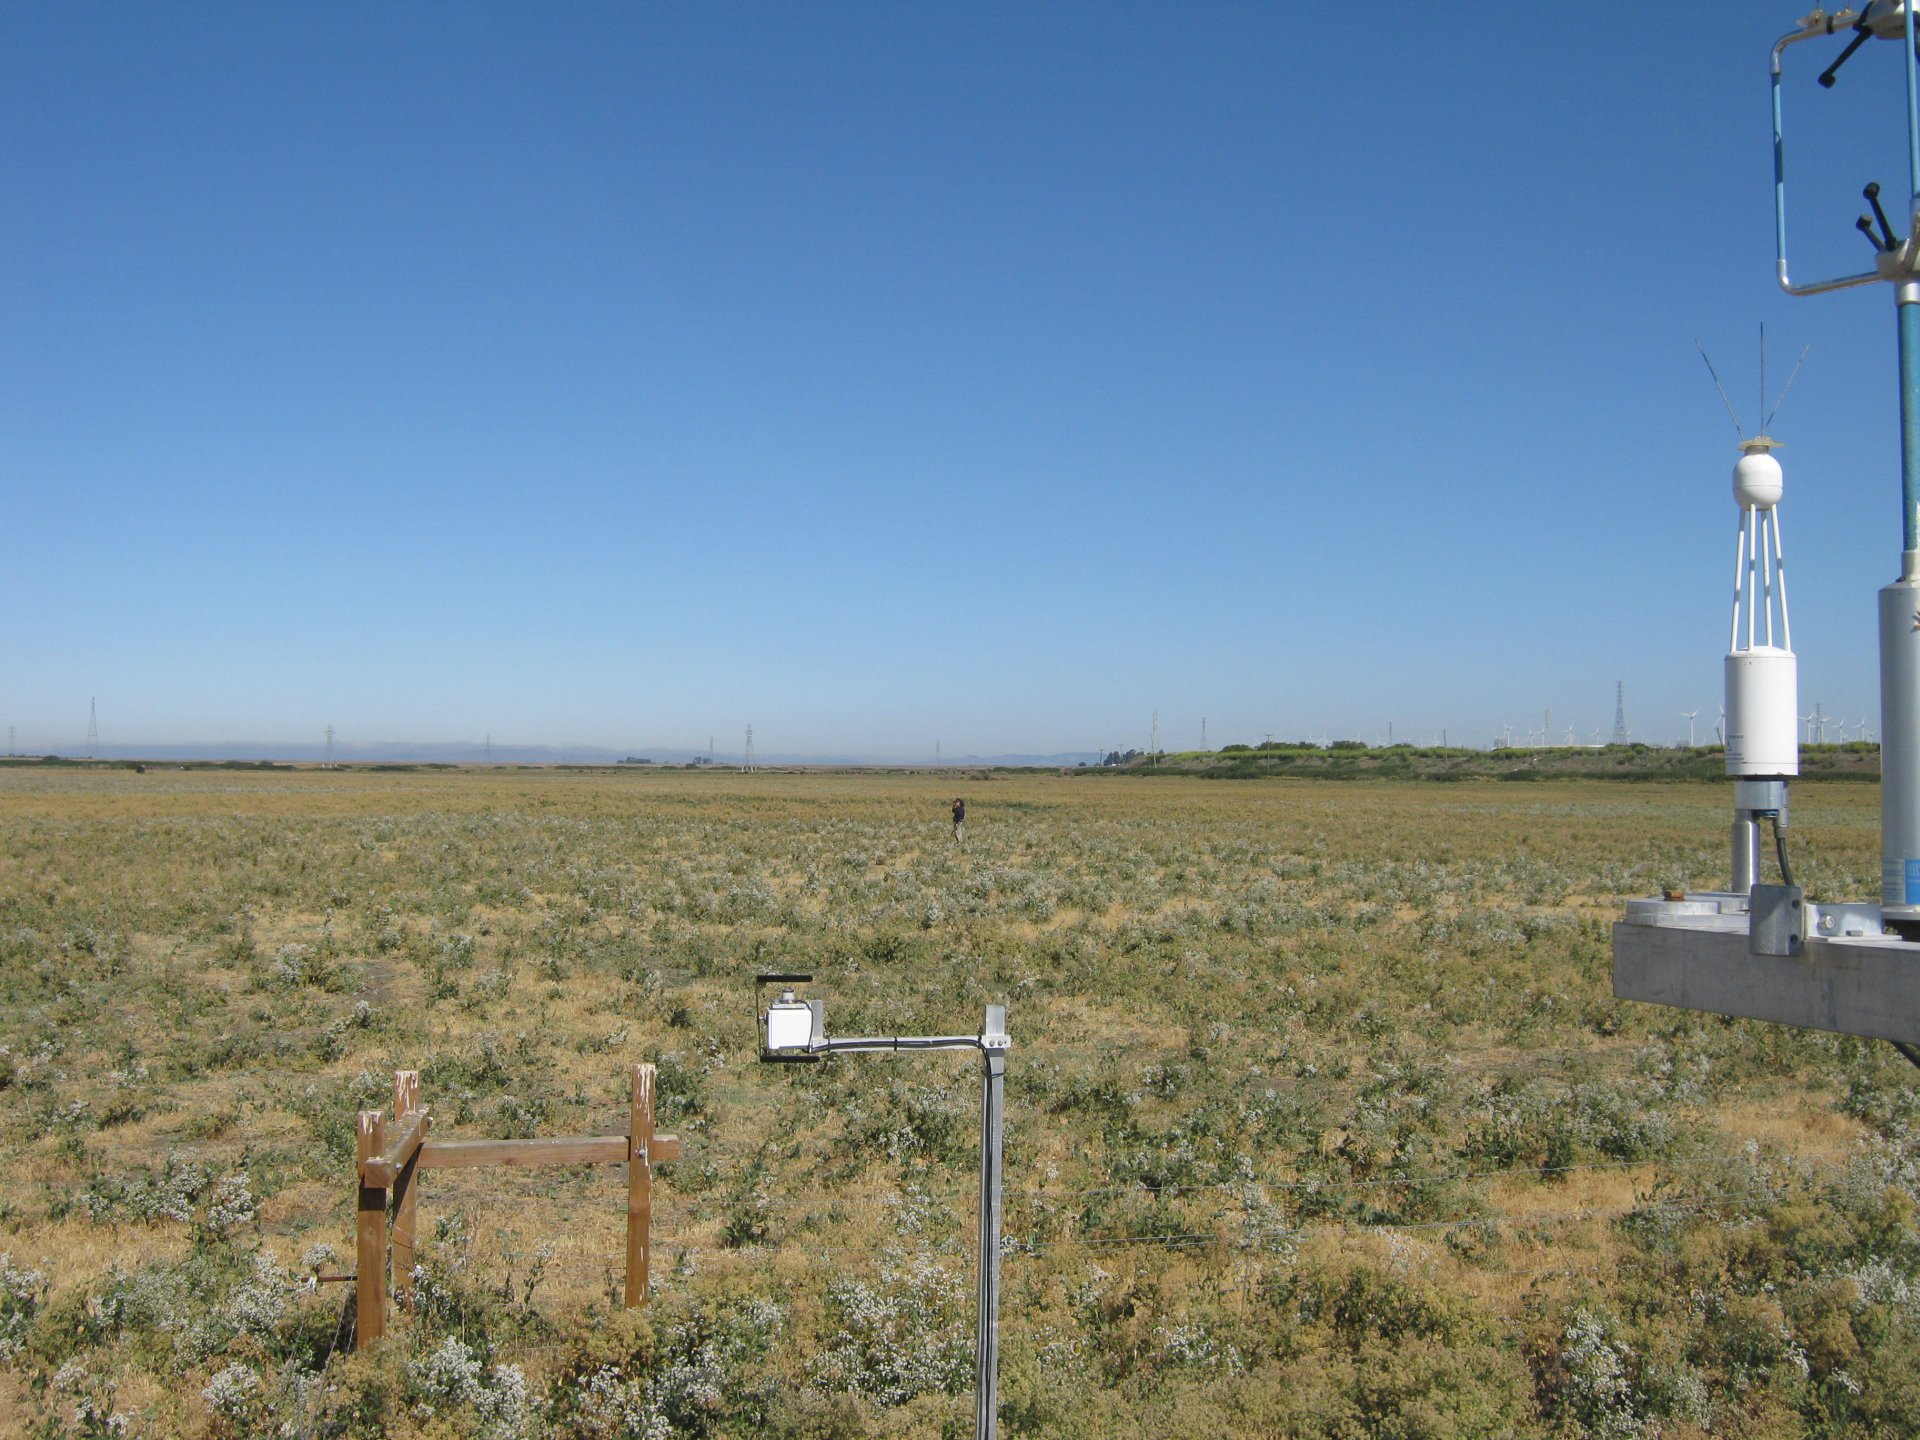
SI_autocam_20130710_0845.jpg ( 2013-07-10 08:45:02 ) Full size: 1920x1440
Fieldwork
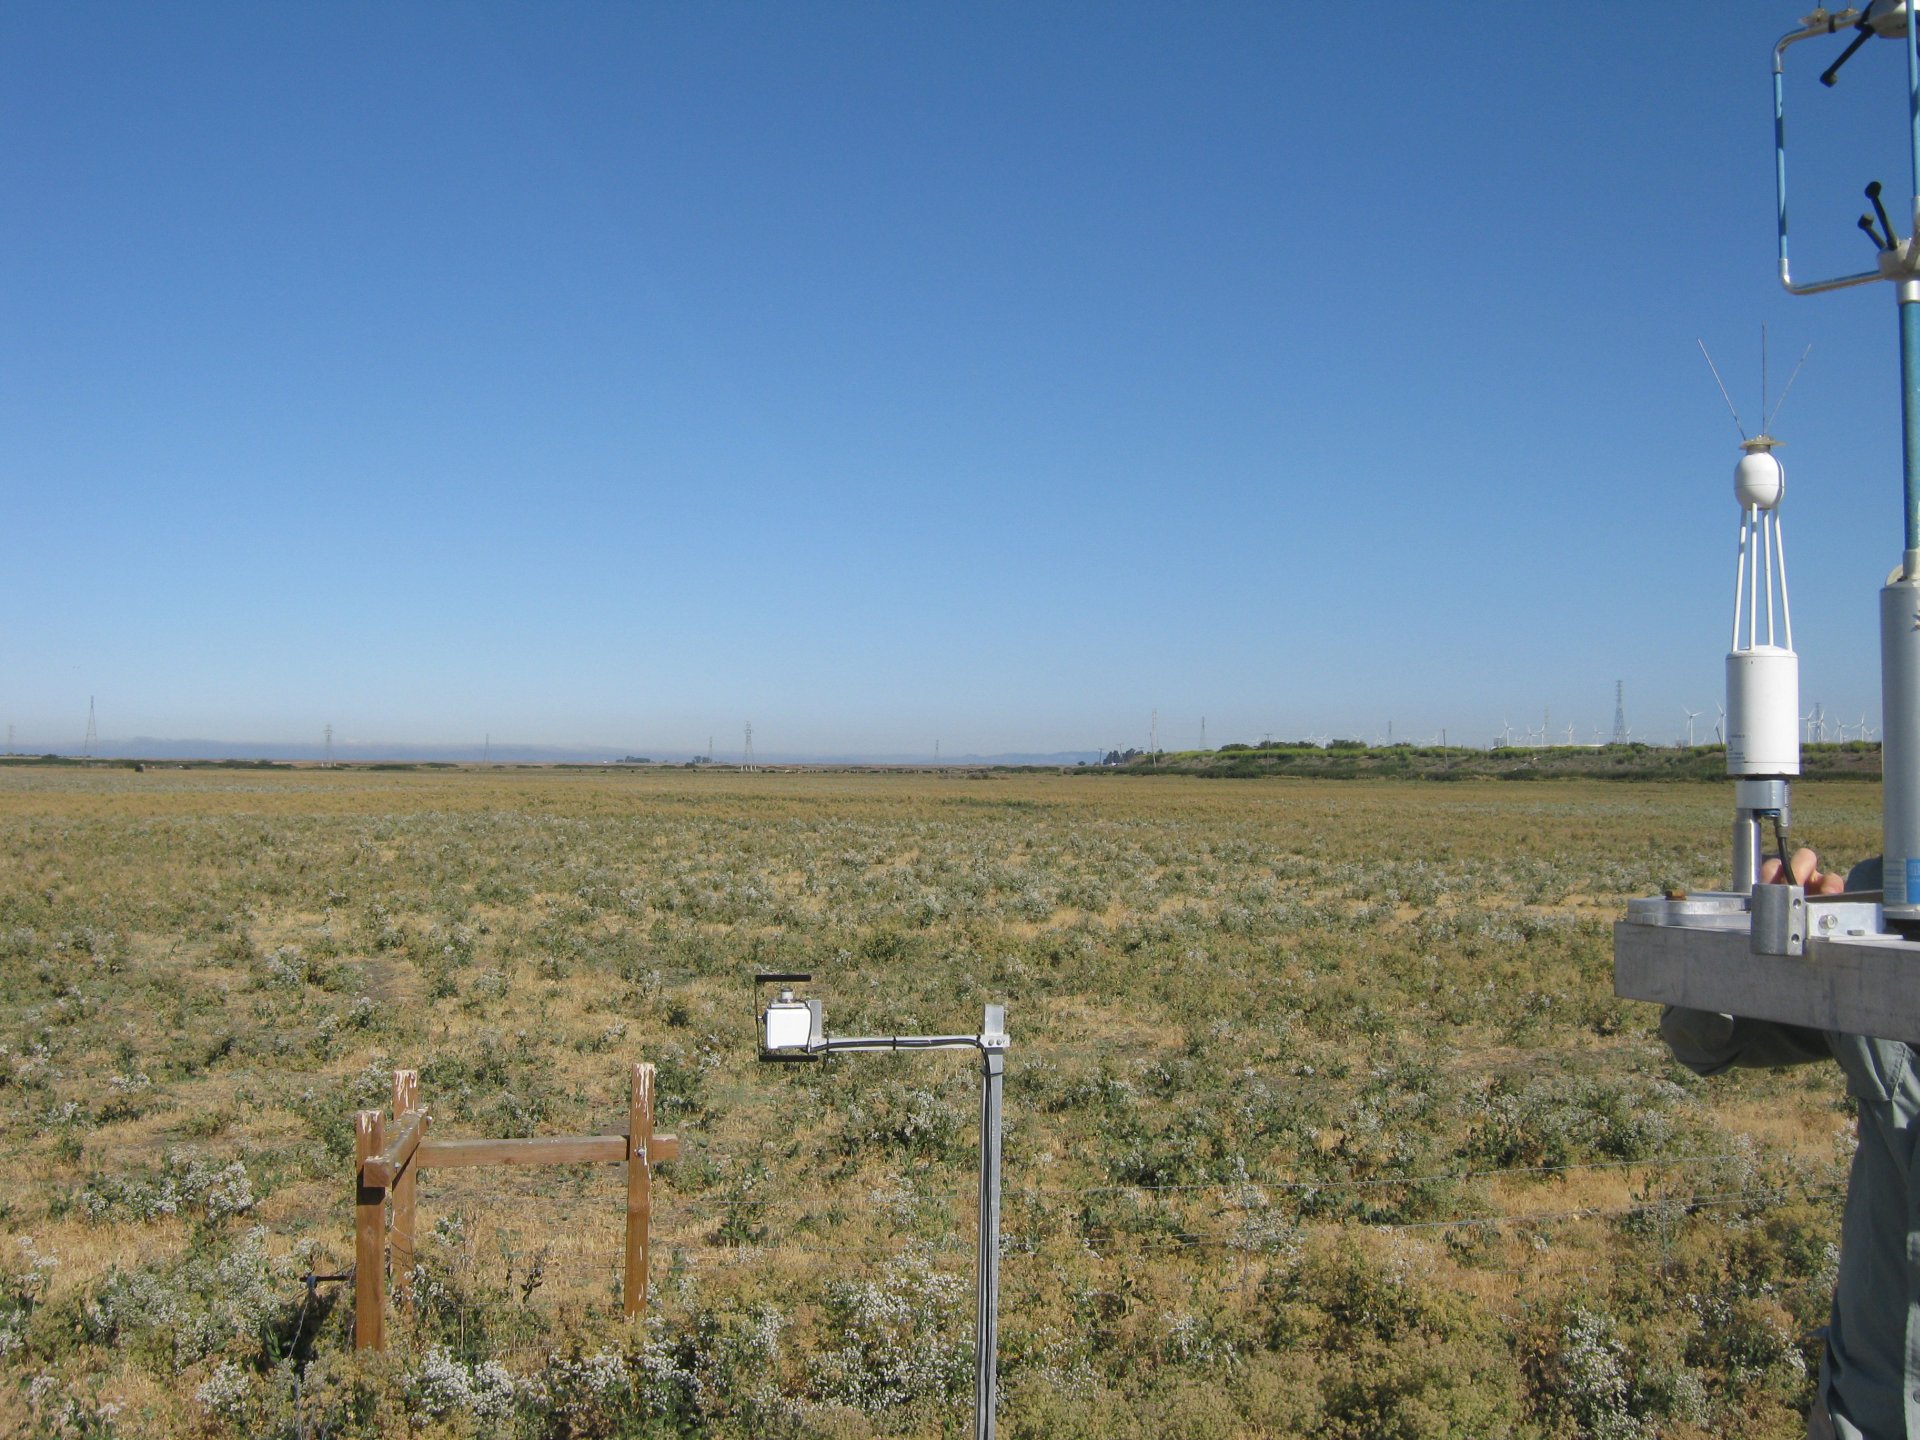
SI_autocam_20130710_0815.jpg ( 2013-07-10 08:15:02 ) Full size: 1920x1440
Fieldwork
7 sets found
No data found for SI_mp.
11 SI_met graphs found
Can't check SI_mixed
2 SI_mixed graphs found
4 SI_flx graphs found
3 SI_soilco2 graphs found
Can't check TWSI_mixed
Can't check SIMBTWEE_met