Field Notes

<--2013-06-27 09:25:00 | 2013-07-16 09:45:00-->
Other sites visited today: Sherman Island | Twitchell Rice | West Pond | Twitchell Alfalfa | DWR Corn
Phenocam link: Searching...

Mayberry: 2013-07-10 10:15:00 (DOY 191)
Author: Joe Verfaillie
Others: Laurie, Yanel, Cristina

Summary: Data collection, swapped 7500 head, water samples, measured eddy sensor positions

Mayberry
2013-07-10

I arrived about 10:15 with Laurie, Yanel and Cristina. It was clear, mild and breezy from the west northwest. I did not notice much change in the site since I was there last May 15th. Maybe the weeds around the tower are a little higher.

Gavin has deployed a bubble trap in the pond to the south of the tower.

I swapped the LI7500 Head, sn 2182 came off and sn 2150 went on. I pulled the USB stick, swapped the head, uploaded the new coefficients, reset the pressure coefficients (57.091, 15.210), pushed the reset button inside the 7550 box, and reinstalled the now empty USB stick. All seemed well. The new 7500 read:

396.3ppm CO2, 704mmol/m3 H2O, 95% Signal Strength, 21.5C, 101.37kPA

The 7700 read: 1.9ppm CH4 with ramps past 2.5ppm, 40 RSSI rising to 77 after cleaning

Cristina cleaned the solar panels. Water samples were collected.

The CO2 probe 1 was maxed out I think it is real.

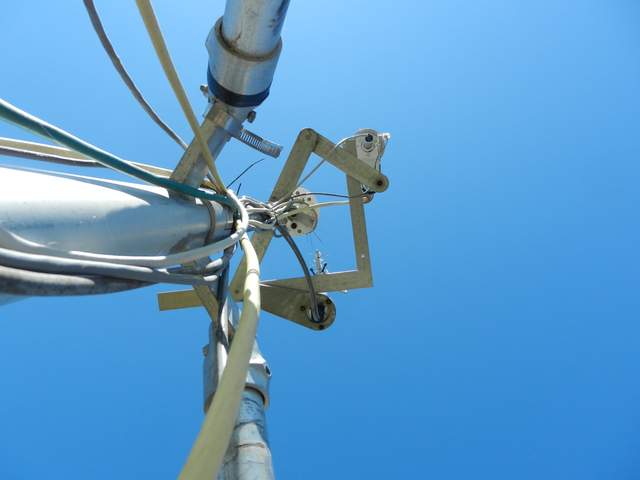
I measured the position of the eddy sensors. Heights to centers are below and there is a photo with ruled square to get the north-south, east-west positions. There is a mark on the sonic mount to indicate true north.

HMP45 281cm agl
LI7700 303cm agl
Sonic 309cm agl
LI7500 308cm agl

Might take the long level and try to get a height of the ground under the tower above the water level.

2 photos found

Position of the eddy sensors
20130710MB_EddyPositions.jpg ( 2013-07-10 10:39:29 ) Full size: 1920x1440
Position of the eddy sensors
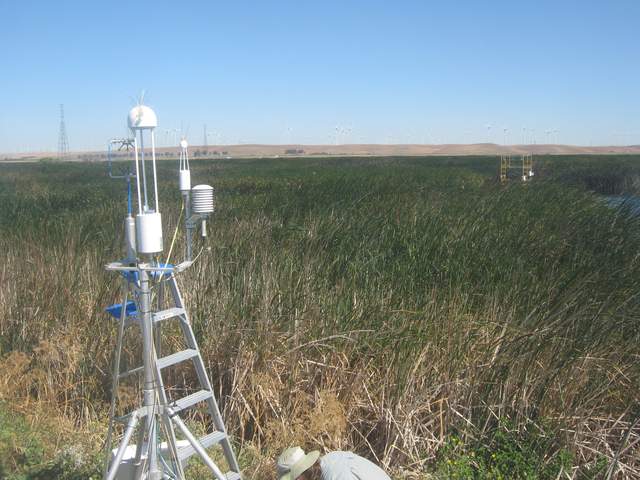
Joe on site
MB_autocam_20130710_1015.jpg ( 2013-07-10 10:15:03 ) Full size: 1920x1440
Joe on site

Graphs display:
11 sets found

7 MB_flux graphs found

Explore the graph:Sonic Wind in a new window

Explore the graph:LI7700 mV signals in a new window

Explore the graph:Counts in a new window

Explore the graph:LI7700 CH4 from analog signal in a new window

Explore the graph:LI7500 CO2 and H2O in a new window

Explore the graph:LI7700 CH4 from digital signal in a new window

Explore the graph:CO2 in ppm in a new window

No data found for MB_met.
27 MB_tule graphs found

Explore the graph:MB Tule Tower: Open Water 2 (3/1/11-3/23/17) in a new window

Explore the graph:MB Tule Tower: Open Water 1 (3/1/11-2/21/13) in a new window

Explore the graph:MB Tule Tower: Tule Temps 2 & 3 (3/1/11-3/19/14) in a new window

Explore the graph:MB Tule Tower: Tule Temps 1 (3/1/11-3/19/14) in a new window

Explore the graph:Mayberry Tule Tower: Solar Radiation in a new window

Explore the graph:Mayberry Tule Tower: Disolved Oxygen in a new window

Explore the graph:Mayberry Tule Tower: IRT and Sensor Temp in a new window

Explore the graph:Mayberry Tule Tower: Volts and RH in a new window

Explore the graph:LED NDVI Sensor in a new window

Explore the graph:Water CO2 in a new window

Explore the graph:Water Pressure in a new window

Explore the graph:Fluorometer Data in a new window

Explore the graph:Mayberry pCO2 Profile in a new window

Explore the graph:Water Temperatures in a new window

Explore the graph:Air Temperatures in a new window

Explore the graph:Air Pressure in a new window

Explore the graph:4-Way Radiometer in a new window

Explore the graph:MB Tule Tower: Open Water 1 (2/21/13-3/19/14) in a new window

Explore the graph:MB Tule Tower: Tule Temps 1 (3/19/14-now) in a new window

Explore the graph:MB Tule Tower: Open Water 1 (3/19/14-now) in a new window

Explore the graph:MB Tule Tower: Tule Temps 2 & 3 (3/19/14-3/23/17) in a new window

Explore the graph:MB Tule Tower: Tule Temps 2 (3/23/17-now) in a new window

Explore the graph:MB Tule Tower: Tule Temps 3 (3/23/17-now) in a new window

Explore the graph:SRS NDVI Channels in a new window

Explore the graph:SRS NDVI in a new window

Explore the graph:Net Radiation in a new window

Explore the graph:Conductivity in a new window

Can't check MBWPEESWGT_mixed
1 MB_cam graphs found

Explore the graph:Mayberry Autocam GCC in a new window

Can't check MBEEWPSWEPGT_cam
Can't check SIMBTWEE_met
No data found for MB_minidot.
Can't check MBSWEEWPBCBA
1 MB_processed graphs found

Explore the graph:Mayberry processed CO2 Fluxes in a new window

Can't check MB_fd
1 MB_fd graphs found

Explore the graph:Water Forced Diffusion CO2 Flux in a new window