
Field Notes
<--2012-10-24 11:30:00 | 2012-11-07 11:00:00-->Other sites visited today: Tonzi | Vaira
Phenocam link: Searching...
Tonzi: 2012-11-07 09:30:00 (DOY 312)
Author: Siyan Ma
Others: Joe
Summary: Swapped Floor 7500, reinstalled LI800, reinstalled SHF plates, Standard fieldwork.
|
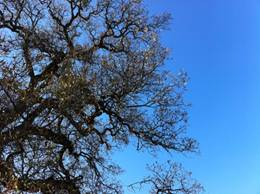
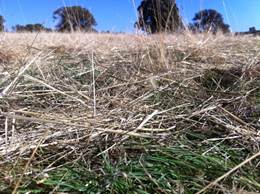
When: Date: 11/07/2012 , Day: 312 , Watch Time: 9:30 am . Where: Tonzi/Vaira Ranch Who: Siyan, Joe Weather: clear, sunny Phenology: grasses came out, about 2~4cm; green/yellow/brown oak leaves still on the trees, but pretty much done.
Summary
Vaira_Grass Site
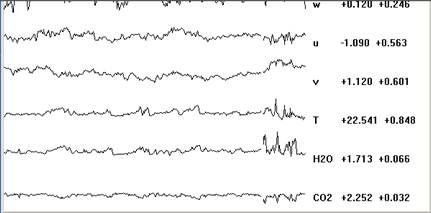
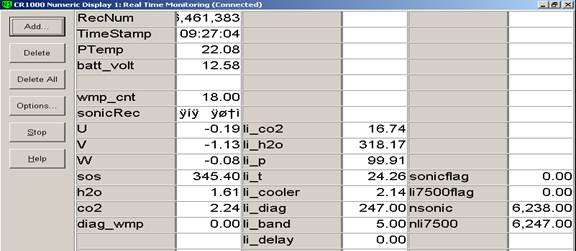
Tonzi_Tower Site
Before zeroing 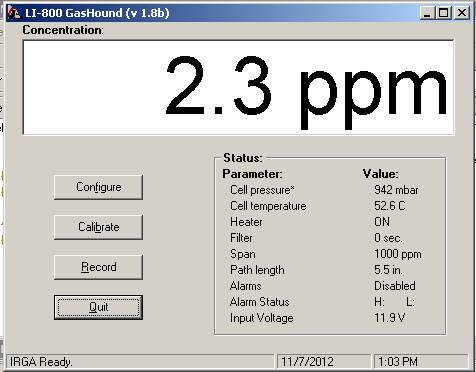
After zeroing 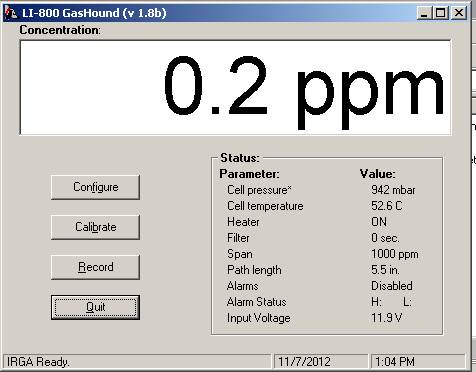
Before spanning 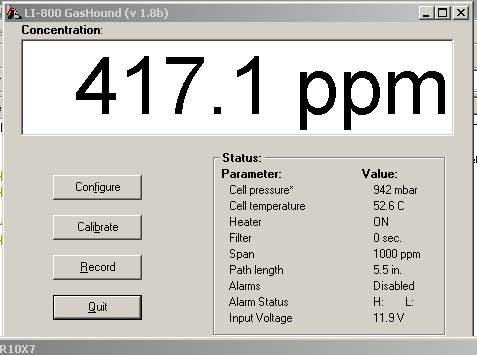
After spanning 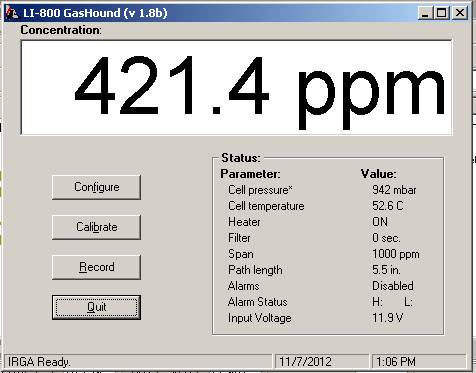 . .
CO2 psig; flow 20 psi; 421.63 ppm. N2 1000 psig; flow 20 psi. Is the pump running Joe put back Gashound gas analyzer and calibrated Li-800 in the field.
Toniz_Floor Site
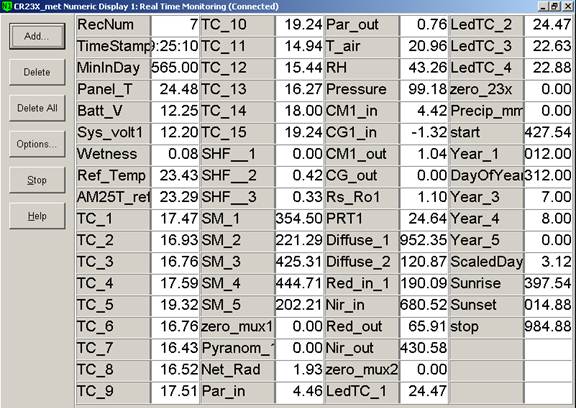
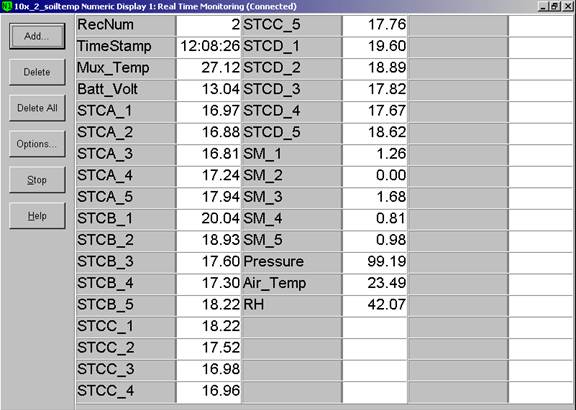
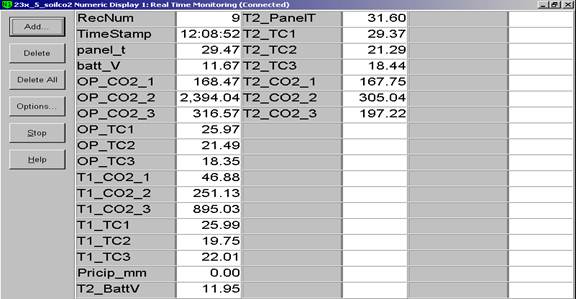
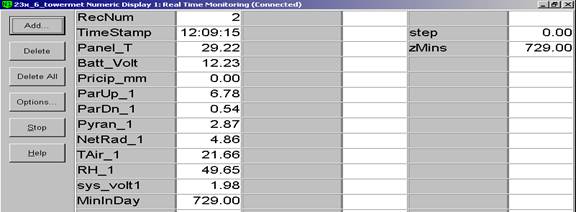
CR23X3 – floor-Met CR23X6 – tower-Met CR10X2 – floor-Met Soil CO2 profile: CR23X5 – soil CO2 profile 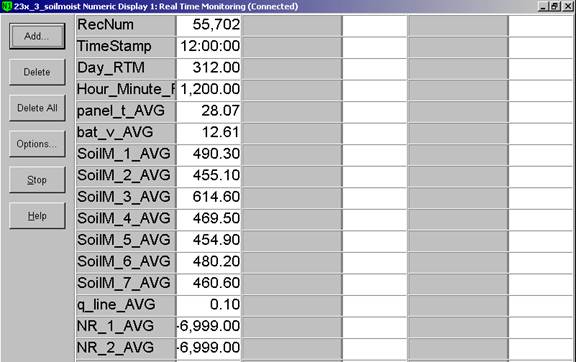
Notes: “X” means not working any more. Dendrometers installed by Gretchen group | ||||||||||||||||||||||||||||||||||||||||||||||||||||||||||||||||||||||||||||||||||||||||||||||||||||||||||||||||||||||||||||||||||||||||||||||||||||||||||||||||||||||||||||||||||||||||||||||||||||||||||||||||||||||||||||||||||||||||||||||||||||||||||||||||||||||||||||||||||||||||||||||||||||||||||||||||||||
Field Data
No tank data
Well Depth
| Date | Location | Depth (feet) |
|---|---|---|
| 2012-11-07 | TZ_floor | 30 |
| 2012-11-07 | TZ_road | 38.8 |
| 2012-11-07 | TZ_tower | 34.9 |
No TZ Moisture Point data found
No VR Moisture Point data found
No TZ grass heigth found
No VR grass heigth found
Tree DBH
| Date | Tag# | Reading (mm) |
|---|---|---|
| 2012-11-07 | 1 | 22.7 |
| 2012-11-07 | 102 | 14.1 |
| 2012-11-07 | 2 | 15.8 |
| 2012-11-07 | 245 | 10.9 |
| 2012-11-07 | 3 | 18.7 |
| 2012-11-07 | 4 | 4 |
| 2012-11-07 | 5 | 24.1 |
| 2012-11-07 | 7 | 16.1 |
| 2012-11-07 | 72 | 12.3 |
| 2012-11-07 | 79 | 11.9 |
| 2012-11-07 | 8 | 8 |
No water potential data found
No TZ Grass Biomass data found
No TZ OakLeaves Biomass data found
No TZ PineNeedles Biomass data found
3 photos found
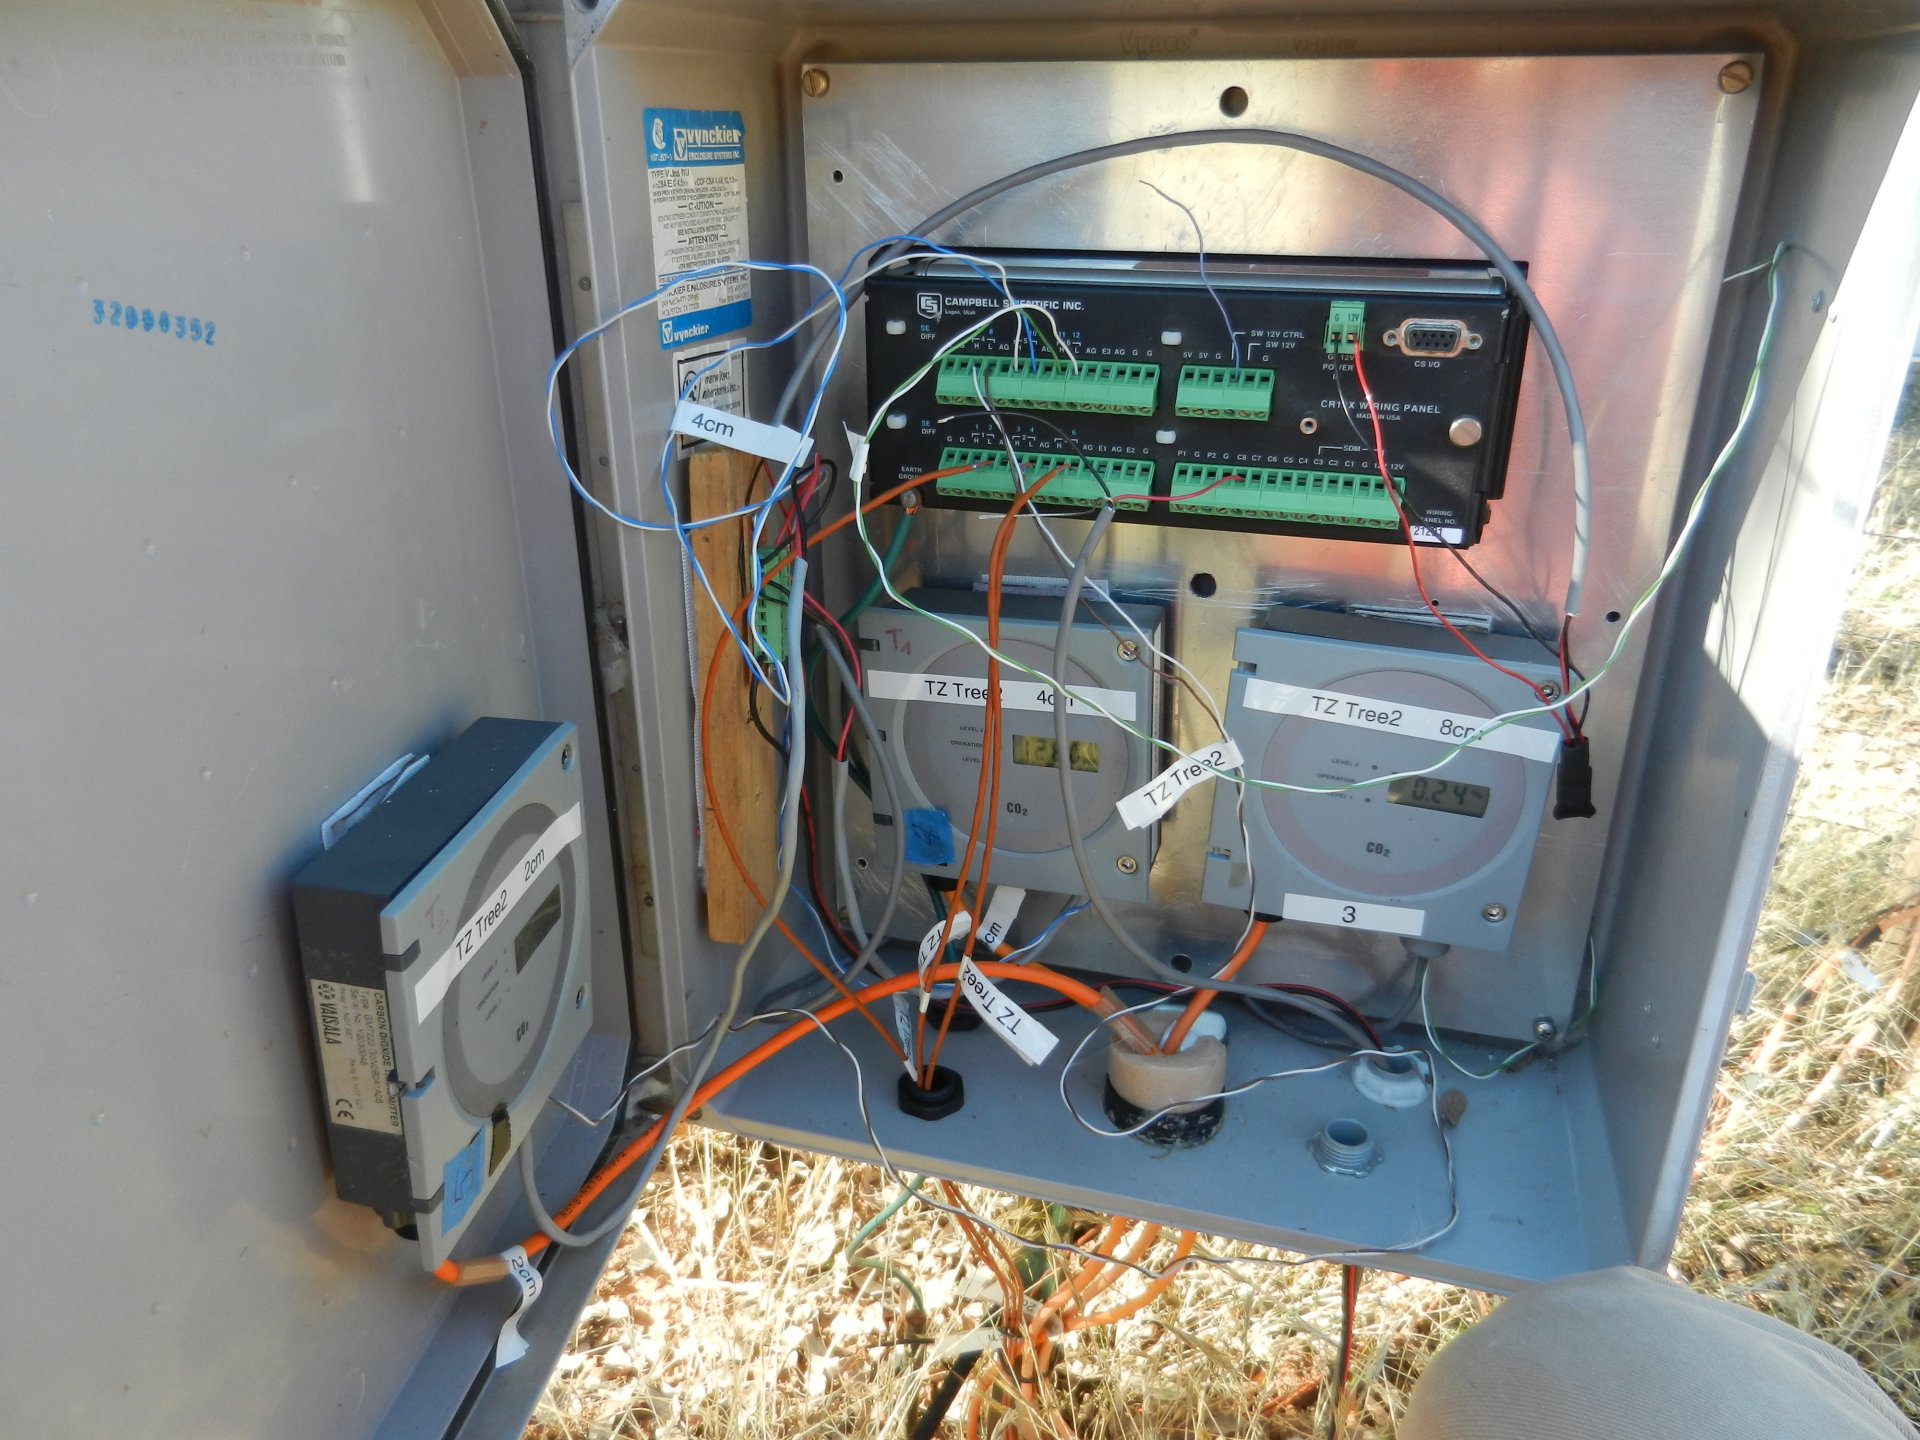
20121107TZ_2ndSoilCO2Box.jpg ( 2012-11-07 14:23:51 ) Full size: 1920x1440
Wiring inside a soil co2 logger box
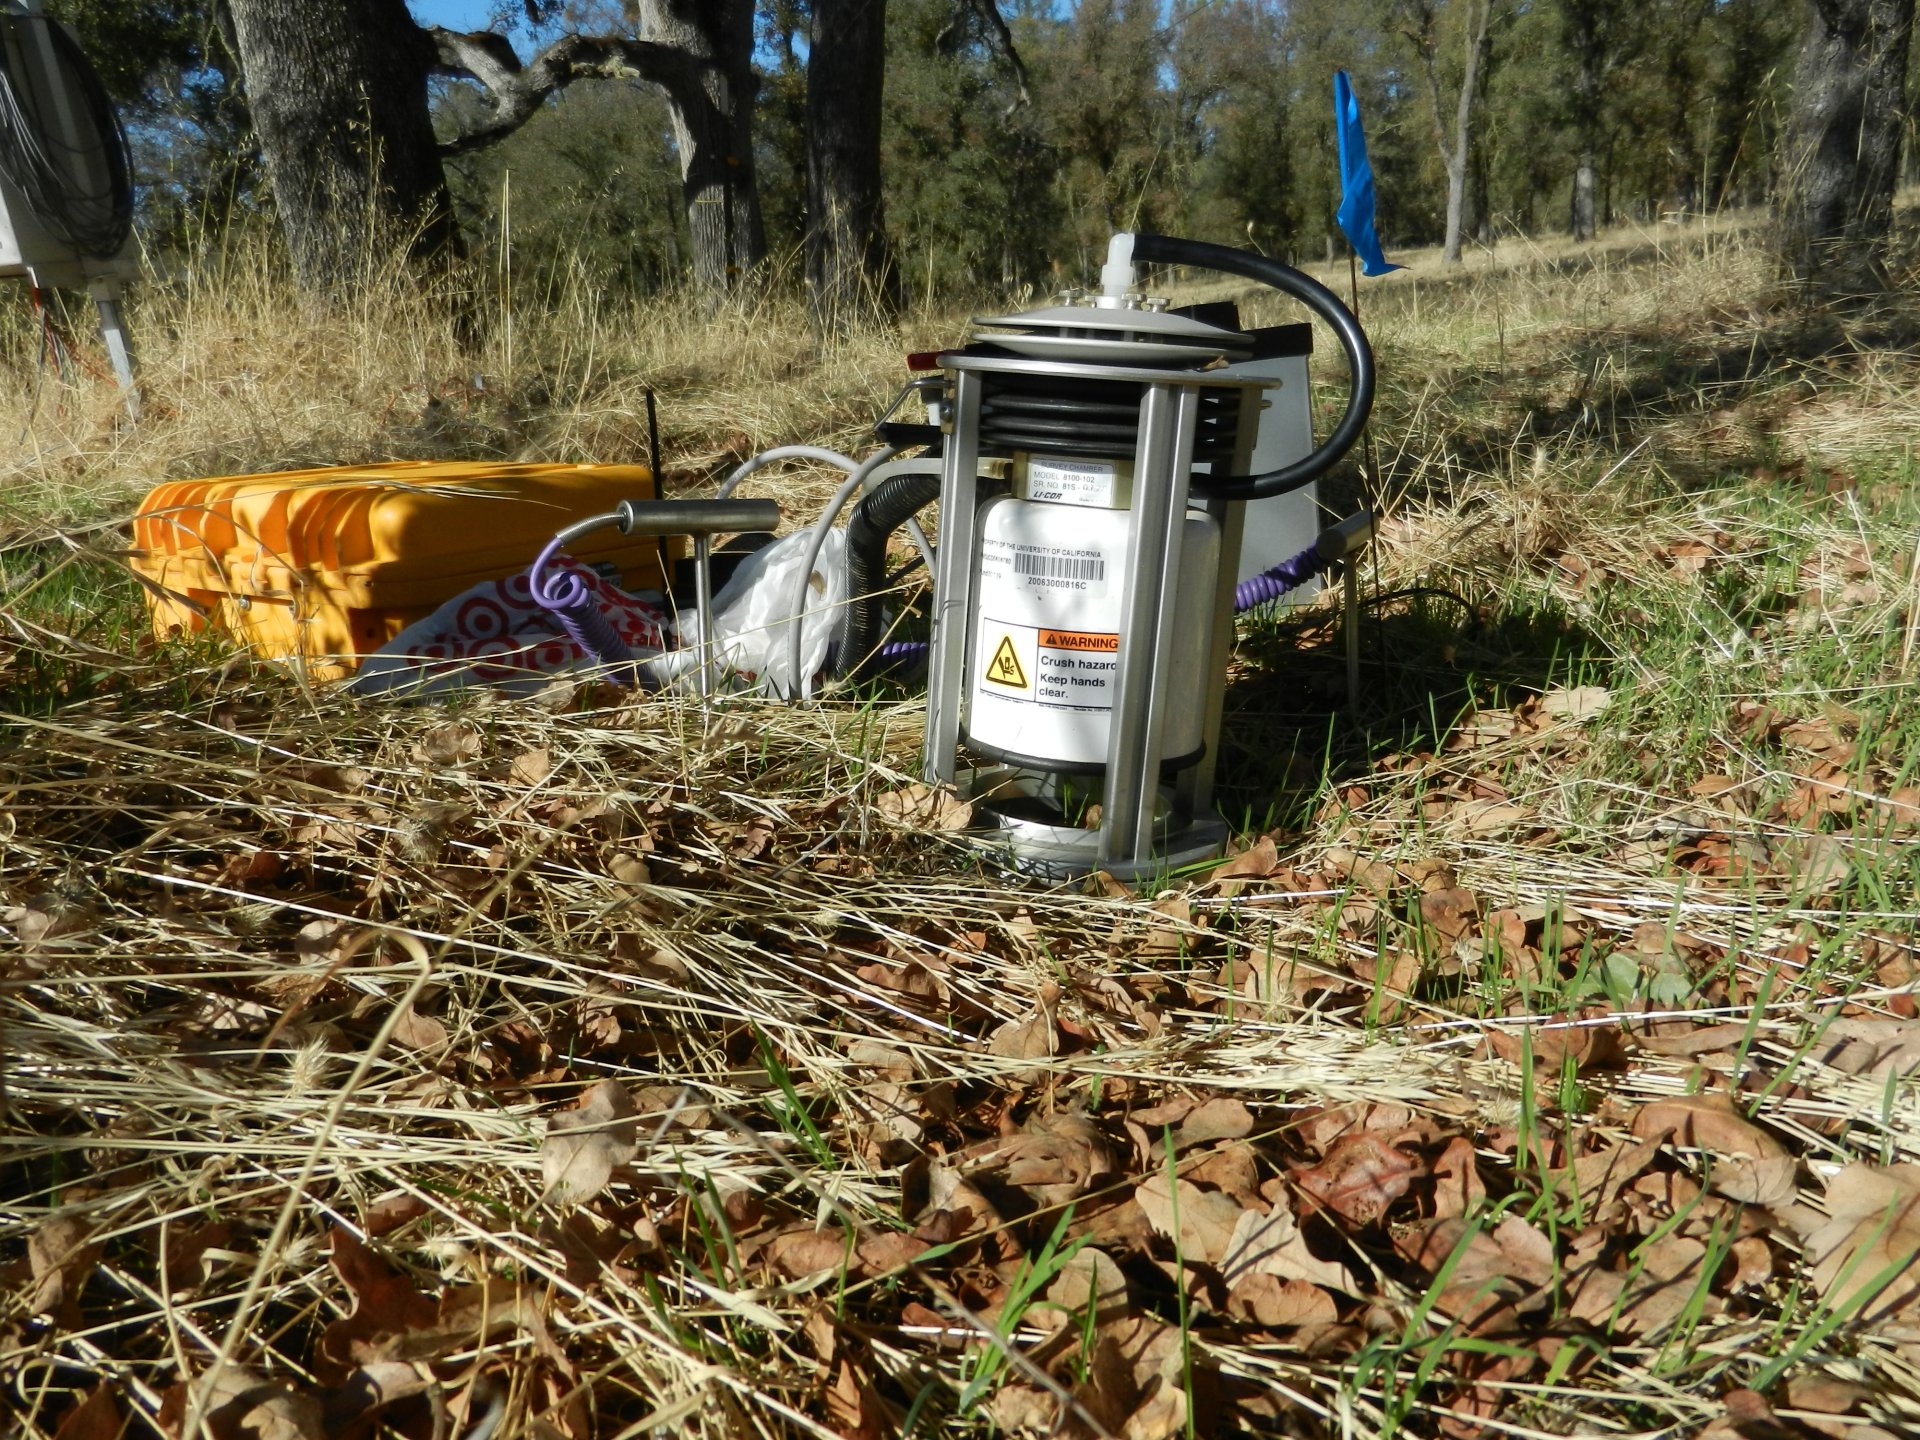
20121107TZ_LI8100SoilCO2.jpg ( 2012-11-07 14:26:14 ) Full size: 1920x1440
Testing Licor soil chamber
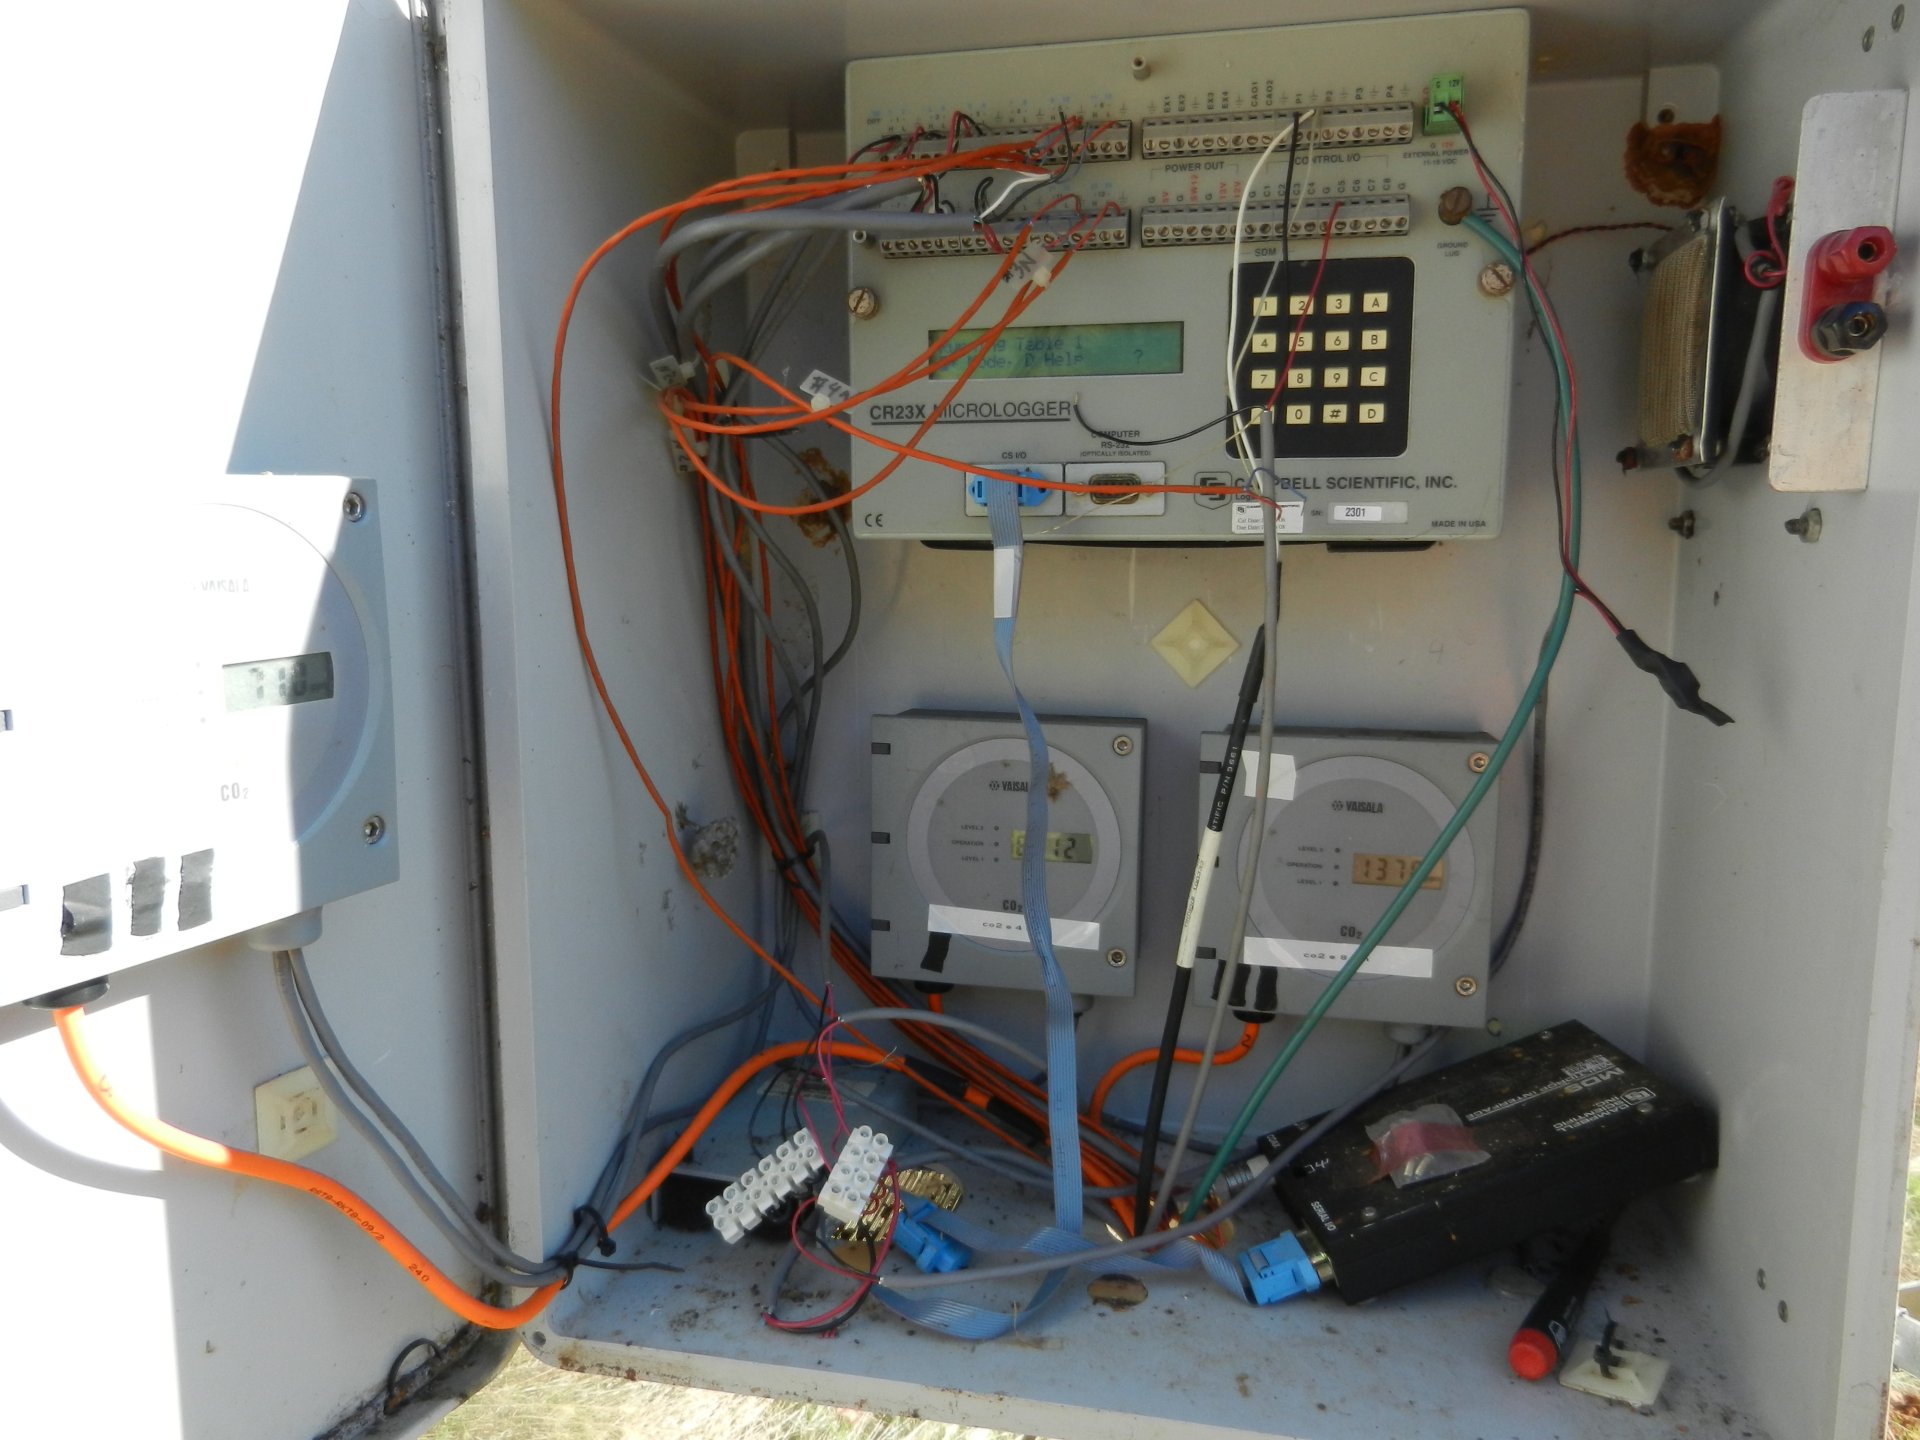
20121107TZ_MainSoilCO2Box.jpg ( 2012-11-07 14:27:13 ) Full size: 1920x1440
Wiring inside soil CO2 data logger box
16 sets found
No data found for TZ_Fenergy.
11 TZ_tmet graphs found
11 TZ_soilco2 graphs found
Can't check TZ_mixed
3 TZ_mixed graphs found
1 TZ_fflux graphs found
8 TZ_fmet graphs found
1 TZ_tram graphs found
3 TZ_co2prof graphs found
No data found for TZ_irt.
No data found for TZ_windprof.
1 TZ_tflux graphs found
2 TZ_sm graphs found
Can't check TZ_met
1 TZ_met graphs found
Can't check TZVR_mixed
8 TZ_osu graphs found
No data found for TZ_fd.
Tonzi Z-cam data