Field Notes

<--2012-10-09 06:00:00 | 2012-11-07 09:30:00-->
Phenocam link: Searching...

Tonzi: 2012-10-24 11:30:00 (DOY 298)
Author: Siyan Ma
Others: Erika

Summary: Just after first rain of the fall, Tree dendrometers read, Swapped 7500 at tower and Vaira, Co2 Profile down, Standard fieldwork.


When: Date: 10/24/2012 , Day: 298 , Watch Time: 11:30 am
Where: Tonzi/Vaira Ranch
Who: Siyan, Erika
Weather: showers on the way and when we just got there; rain stopped after; partially cloudy and sunshine
Phenology: Mr. Tonzi got more than 1.5 inches in his back yard; grasses were still yellow but new germination would start soon after this first good rain in the fall. Oak leaves kept falling off. Erika measured tree bands.

1.standing water at Tonzi

2. an overview

Puddles and shadows on dirt road at Tonzi

View of oak savanna from the tower at Tonzi

3. disturbed area at Vaira

4, the lower wire of the fence missing

Cleared area near solar panels at Vaira

Broken cow fence at Vaira

Summary
  1. checked and downloaded data at Tower, Floor, and Vaira
  2. Swapped Li-7500 at TZ Tower and Vaira.
  3. Gashound Li-800 didn’t work in the field and was taken back to the lab.
  4. Erika helped with measuring tree bands.
  5. Measure groundwater well: The battery was dead. I changed a new battery, but the rope ruler didn’t work very well. Measurements were made by estimation.

Date

DOY

Location

Depth without the black thing (feet)

10/24/2012

298

Floor

29.7


Tower

35.0


roadside

37.0

Vaira_Grass Site
  1. Fence and gate power: - v. (Fence was open when I got there.)
  2. Panel and Batteries: - v; - amps; - amps.
  3. Reading from Gillsonic screen before downloading data. (The value of H2O and CO2 should be in the range of 0 – 5 v.)

Vaira Gill sonic plots screen before downloading data
Readings of CR1000:
Screen shot of Vaira flux data logger table
  1. download data and swap data card of CR1000. YES!
  2. Swap IRGA Licor-7500: #418 on; #41 off.
  3. Check the fans of air temp and relative humidity sensors at Vaira. YES!
  4. Check MD-9 system connections and check CR23X with two multiplexers

Can’t talk to CR10X for soil CO2 profiles from the computer. Was able to download soil CO2 data by connecting directly to the CR10X.


Screen shot of Vaira met data logger table

  1. Check levels of Radiation sensors, clear up surfaces. YES!
  2. Check rain gage, make sure not clogged. YES!
  3. Closed gate and set up fence. YES! The lower wire of the fence was broken and missed the yellow ending. Need to be fixed next visiting.

Tonzi_Tower Site

  1. Fence and gate power: 12 v.
  2. Panel and Batteries: - v; - amps; - amps.
  3. Reading from Gillsonic screen before downloading data. (The value of H2O and CO2 should be in the range of 0 – 5 v.)

Tower Gill sonic plots screen before downloading data
  1. download data and swap data card of CR1000. YES!
  2. Swap IRGA Licor-7500: #1594 on; #976 off.
  3. check the fans of air temp. and relative humidity sensors on the tower and the floor. YES!
  4. Check rain gage, make sure not clogged. YES!
  5. Is the pump running‌ YES! But the readings of gashound were -99999

Screen shot of Li-800 calibration pre-cal
  1. close gate and set up fence. YES!

Toniz_Floor Site
  1. Fence and gate power: 12 v.
  2. Panel and Batteries: - v; - amps; - amps.
  3. Reading from Gillsonic screen before downloading data. (The value of H2O and CO2 should be in the range of 0 – 5 v.)

Floor Gill sonic plots screen before downloading data
Readings of CR1000 before clearing 7500 of water droplets
Screen shot of floor flux data logger table
  1. download data and swap data card of CR1000. YES!
  2. Check MD-9 system connections YES!

Screen shot of floor met data logger table

Screen shot of soil co2 data logger table

Screen shot of tower met data logger table

Screen shot of sap flow data logger table
  1. Close gate and set up fence. YES!


Tonzi


Dendrometer


Date

Day

Tag #

Reading (mm)


9/19/2012

263

1


2

15.4


3

18.3


4


5

24.0


7


8


72


79


102


245

10.9


Soil moisture profiles (missing points at Tonzi because time ran late.)

vaira

7933dee

00000128B97F3

00000128B8072

00000128BDDE8

0-15

13.1

14.1

8.8

3.6

15-30

6.9

4.95

7.8

7.8

30-45

12.8

2.4

8.4

11.9

45-60

24.5

14.5

7.9

15.9


On average, only the two top layers of the soil got wet after the rain.
Line plot of soil moisture profile

Tree band survey (with Erika’s help):
  • Total number of trees surveyed: 110
  • Total number of dead trees: 8 (total mortality: 7.2%)
  • During 2011-2012:

1) Number of dead oaks: 4
2) Mortality increment: 3.8%
3) Average of increment: 0.26 +/- 0.49 cm in perimeter (without soaking effects of rain)
  • Things may be improved: add more bands on pines‌‌

Field Data

No tank data

Well Depth

DateLocationDepth (feet)
2012-10-24TZ_floor29.7
2012-10-24TZ_road37
2012-10-24TZ_tower35

No TZ Moisture Point data found

No VR Moisture Point data found

No TZ grass heigth found

No VR grass heigth found

Tree DBH

DateTag#Reading (mm)
2012-10-24215.4
2012-10-2424510.9
2012-10-24318.3
2012-10-24524

No water potential data found

No TZ Grass Biomass data found

No TZ OakLeaves Biomass data found

No TZ PineNeedles Biomass data found

1 photos found
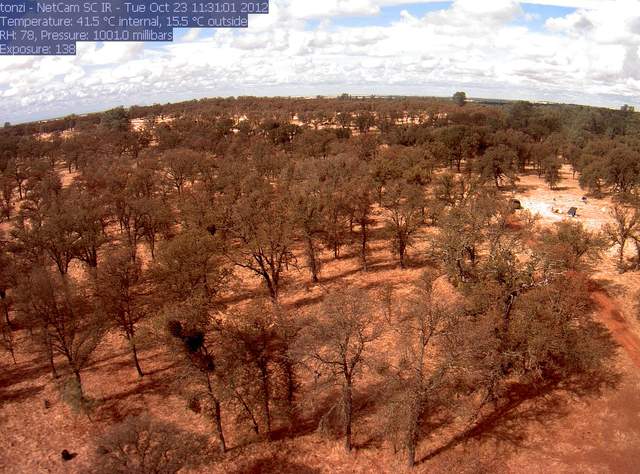
Nice clouds, Sonia and Jessica on site
tonzi_2012_10_23_113101.jpg ( 2012-10-23 10:27:18 ) Full size: 1296x960
Nice clouds, Sonia and Jessica on site

Graphs display:
16 sets found

No data found for TZ_Fenergy.
11 TZ_tmet graphs found

Explore the graph:Tonzi Tower Met: Temperature and Power in a new window

Explore the graph:Tonzi Tower Met: Solar Radiation in a new window

Explore the graph:Tonzi Tower Met: IRT Sensors in a new window

Explore the graph:LED Sensor Incoming in a new window

Explore the graph:LED Sensor Outgoing in a new window

Explore the graph:4-Band Solar Radiation in a new window

Explore the graph:Air Temperature Profile in a new window

Explore the graph:Relativity Humidity Profile in a new window

Explore the graph:Tonzi Tower PRI in a new window

Explore the graph:SRS PRI/NDVI in a new window

Explore the graph:SRS NDVI in a new window

11 TZ_soilco2 graphs found

Explore the graph:Tonzi Soil CO2 Profile: Open (East) CO2 in a new window

Explore the graph:Tonzi Soil CO2 Profile: Tree (West) CO2 in a new window

Explore the graph:Tonzi Soil CO2 Profile: Open (East) Temperatures in a new window

Explore the graph:Tonzi Soil CO2 Profile: Tree (West) Temperatures in a new window

Explore the graph:Tonzi Soil CO2 Profile: Upper CO2 in a new window

Explore the graph:Tonzi Soil CO2 Profile: Lower CO2 in a new window

Explore the graph:Tonzi Soil CO2 Profile: Upper Temperatures in a new window

Explore the graph:Tonzi Soil CO2 Profile: Lower Temperatures in a new window

Explore the graph:Tonzi Soil CO2 Profile: Power and Temperature in a new window

Explore the graph:Tree 2 Soil CO2 in a new window

Explore the graph:Tree 2 Soil Temperature in a new window

Can't check TZ_mixed
3 TZ_mixed graphs found

Explore the graph:Tonzi PPT in a new window

Explore the graph:Tonzi CO2 and H2O Densities in a new window

Explore the graph:Air Pressure in a new window

1 TZ_fflux graphs found

Explore the graph:Tonzi Wind Speed in a new window

8 TZ_fmet graphs found

Explore the graph:Soil Heat Flux in a new window

Explore the graph:Tonzi Soil Temperature Set A in a new window

Explore the graph:Tonzi Soil Temperatures Set B in a new window

Explore the graph:Tonzi Soil Temperatures Set C in a new window

Explore the graph:Tonzi Soil Temperature Set D in a new window

Explore the graph:Well Level in a new window

Explore the graph:Well Water Temperature in a new window

Explore the graph:Soil Water Potential in a new window

1 TZ_tram graphs found

Explore the graph:Tonzi Tram Incoming PAR in a new window

3 TZ_co2prof graphs found

Explore the graph:Tower CO2 Profile Concentrations in a new window

Explore the graph:Tower CO2 Profile Cell Pressure in a new window

Explore the graph:CO2 Profile Sensor Temperature in a new window

No data found for TZ_irt.
No data found for TZ_windprof.
1 TZ_tflux graphs found

Explore the graph:Tower CO2 and H2O in a new window

2 TZ_sm graphs found

Explore the graph:Floor Solar Radiations in a new window

Explore the graph:TZ Soil Moisture in a new window

Can't check TZ_met
1 TZ_met graphs found

Explore the graph:Floor and Tower RH in a new window

Can't check TZVR_mixed
8 TZ_osu graphs found

Explore the graph:Soil Moisture And Rain in a new window

Explore the graph:SP1 Solar Radiation in a new window

Explore the graph:SP1 Soil Temperature Profile in a new window

Explore the graph:SP1 Soil Heat Flux in a new window

Explore the graph:SP2 Soil Moisture in a new window

Explore the graph:SP2 Soil Temperature in a new window

Explore the graph:SP3 Soil Moisture in a new window

Explore the graph:SP3 Soil Temperature in a new window

No data found for TZ_fd.
Tonzi Z-cam data

plot of Tonzi z-cam LAI

plot of Tonzi z-cam gap fration