Field Notes
<--2012-10-09 09:00:00 | 2012-11-15 09:00:00-->Other sites visited today: Tonzi | Tonzi
Phenocam link: Searching...
Vaira: 2012-11-07 09:00:00 (DOY 312)
Author: Joe Verfaillie
Others: Siyan
Summary: Reinstalled SHF plate, installed Vaisala relay and changed program, restarted computer.
| Varia
2012-11-07 I arrived about 9am PST with Siyan. It was clear, sunny and warm with a very light breeze from the southwest. The last rain has really reduced the standing litter. The ground surface is dry and there was no water in the water hole. The trees still have quite a few leaves – maybe 20 to 30%. Grass has sprouted to about 5cm but looks a bit stressed. Just as we were leaving, we met a Vaira man. I didn’t get is full name, but he seemed amiable and shook hands with us. He was there to exercise a young horse. The lower wire of the fence was bundled around the fence post in the northeast corner. About half the wire plus the gate latch was missing. I strung it back along the north side of the fence but will have to get some more wire and a latch handle for next time. We reinstalled SHF plate sn 001603. I installed it in its original location, but as we were leaving Siyan noticed that the shadow of the radiation tower was falling on its location. We relocated it to the north near another SHF plate. Siyan cleared litter from the new installation to compare against the older litter covered plate. Loggernet on the computer had a problem connecting to the soil co2 CR10X. I had to restart the computer to clear the hang up. I collected the soil CO2 data on the field computer. I worked on installing a relay to turn the Vaisala probes on and off. The program on the data logger now turns on the Vaisala probes at 9min into the half hour and logs three minutes of data from minutes 14 through 16 minutes into the half hour. It seemed to be working but I’m still a little worried about the way the data is averaged. I cleaned the radiation sensors. |
Field Data
No tank data
Well Depth
| Date | Location | Depth (feet) |
|---|---|---|
| 2012-11-07 | TZ_floor | 30 |
| 2012-11-07 | TZ_road | 38.8 |
| 2012-11-07 | TZ_tower | 34.9 |
No TZ Moisture Point data found
No VR Moisture Point data found
No TZ grass heigth found
No VR grass heigth found
No VR Tree DBH found
No water potential data found
No VR Grass Biomass data found
No VR OakLeaves Biomass data found
No VR PineNeedles Biomass data found
8 photos found
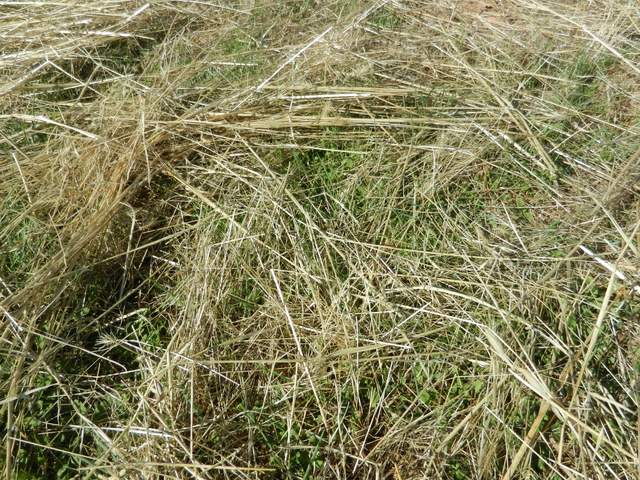
20121107VR_GrassSprouts.jpg ( 2012-11-07 11:38:06 ) Full size: 1920x1440
New grass coming up through the dead grass
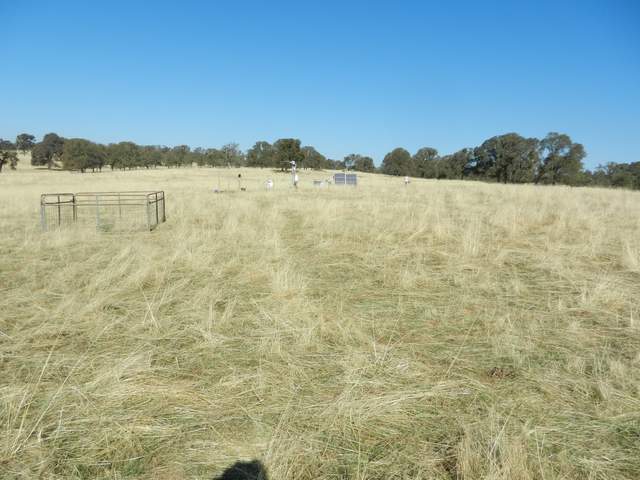
20121107VR_Site.jpg ( 2012-11-07 11:38:15 ) Full size: 1920x1440
Grass sprouts under dead grass
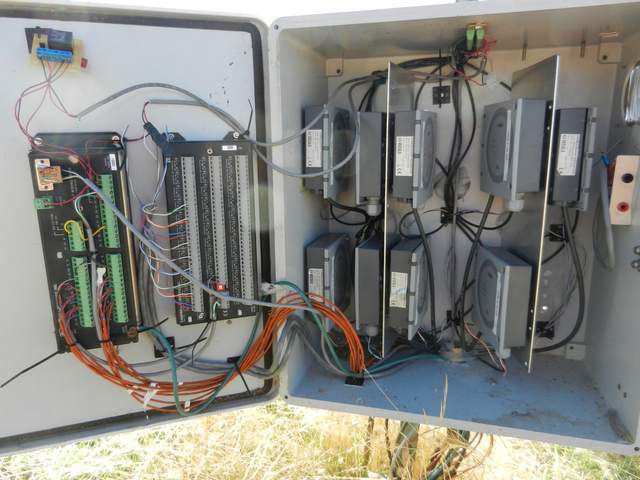
20121107VR_SoilCO2Box.jpg ( 2012-11-07 11:42:05 ) Full size: 1920x1440
Wiring inside the soil CO2 data logger box
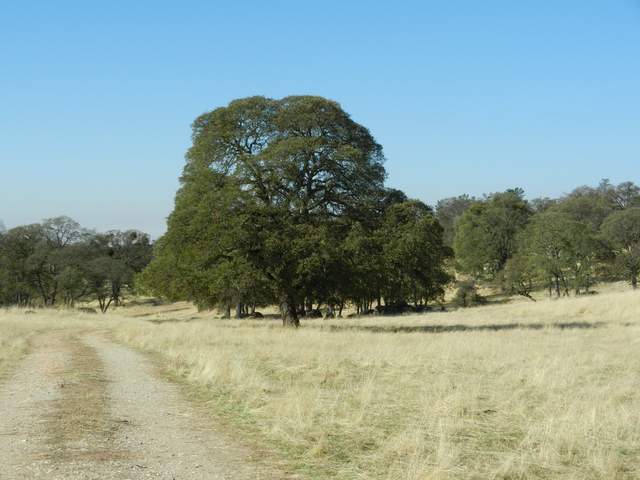
20121107VR_TheTree.jpg ( 2012-11-07 11:37:44 ) Full size: 1920x1440
Big tree near Vaira site
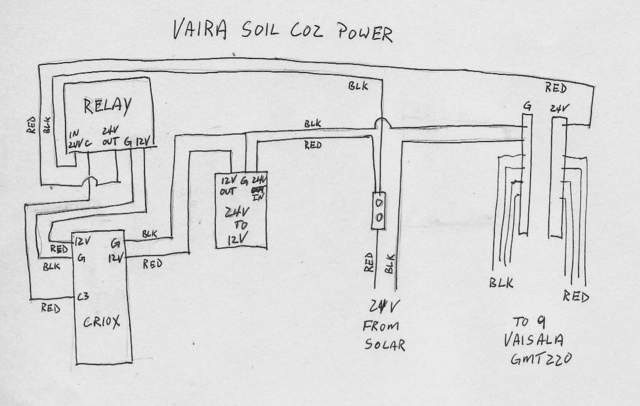
20121107VR_VairaSoilCO2Power.jpg ( 2012-11-08 10:58:59 ) Full size: 1094x694
Wiring diagram of power at Vaira
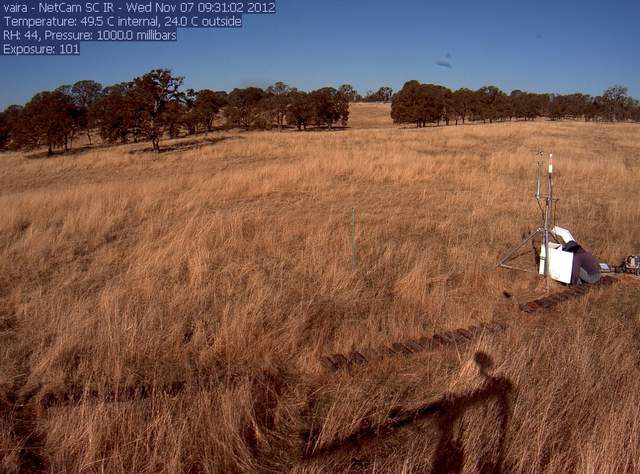
vaira_2012_11_07_093102.jpg ( 2012-11-07 09:25:14 ) Full size: 1296x960
Siyan on site
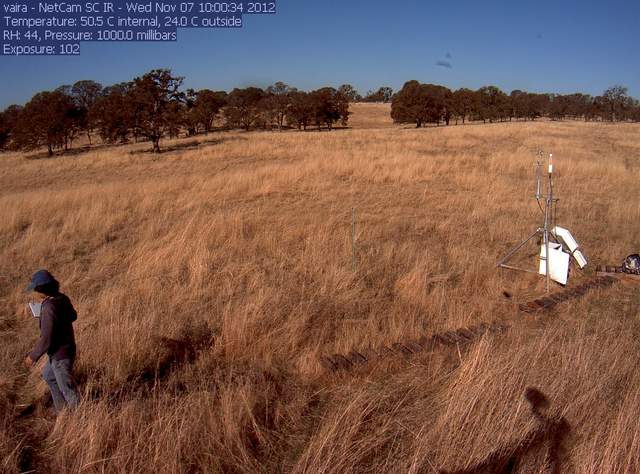
vaira_2012_11_07_100102.jpg ( 2012-11-07 09:55:14 ) Full size: 1296x960
Siyan on site
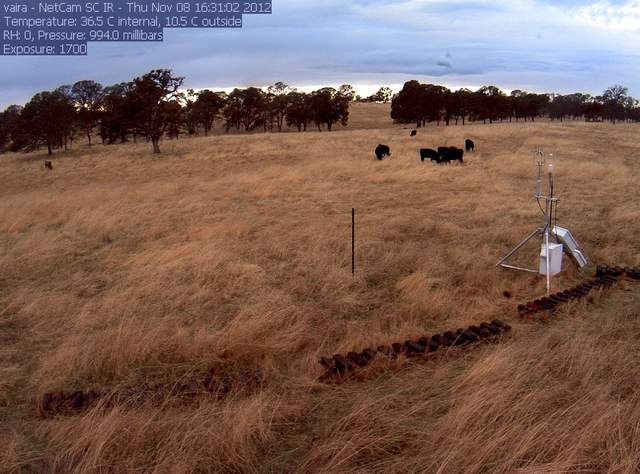
vaira_2012_11_08_163102.jpg ( 2012-11-08 16:23:40 ) Full size: 1296x960
Cows
9 sets found
16 VR_met graphs found
2 VR_flux graphs found
6 VR_soilco2 graphs found
No data found for VR_pond.
Can't check TZVR_mixed
No data found for VR_fd.
No data found for VR_processed.
No data found for VR_arable.
No data found for VR_soilvue.

