Field Notes
<--2012-09-20 09:45:00 | 2012-10-04 10:00:00-->Other sites visited today: DWR Corn | West Pond | Twitchell Rice | Mayberry
Phenocam link: Searching...
Sherman Island: 2012-09-27 09:15:00 (DOY 271)
Author: Joe Verfaillie
Others: Sara, Cove, Laurie
Summary: Collected data, soil chambers, installed ATI sonic for comparison.
| Sherman
2012-09-27 I arrived about 9:15am PDT with Cove, Sara and Laurie. It was clear and sunny, warming quickly with a dying breeze from the west. The water level in the ditches and in the fields under the bridge seemed high. The middle ditch in the field was completely full. The pepper weed seems to be still gaining green through it looked a little trampled by the cows. The cows have been working over the power pole and boxes. I need to repair the fence around it. The LGR read: 8:19PST, 23.96C, 140.9Torr, 13.81usec, 10Hz, 2.05ppm Cove adjusted the bypass valve to bring the pressure up to 145.5Torr. The met and soil CO2 looked okay, as did the flux data: CO2 = 17.4 mmol/m3, H2O = 660 mmol/m3, P = 101.3, T = 19.56, Diag = 248 We collected all the data and Sara measured soil flux. We installed an ATI sonic borrowed from the Goldstein lab. The ATI is mounted directly south of the Gill sonic at the same height. The ATI sonic is connected to the CR1000 by its RS232 port. I added an adapter so that the computer now talks to the CR1000 on the CSI/O port. The ATI data (U, V, W, and SOS) is being collected at 10Hz in a third, separate table within the data logger. This should synchronize the data, but not change the format of the existing tables. The CR1000 program was changes after swapping cards. The ATI is using 19200, 7, 1, even for coms. I cleaned the radiometers and tipping bucket – they were all slightly dirty. |
9 photos found
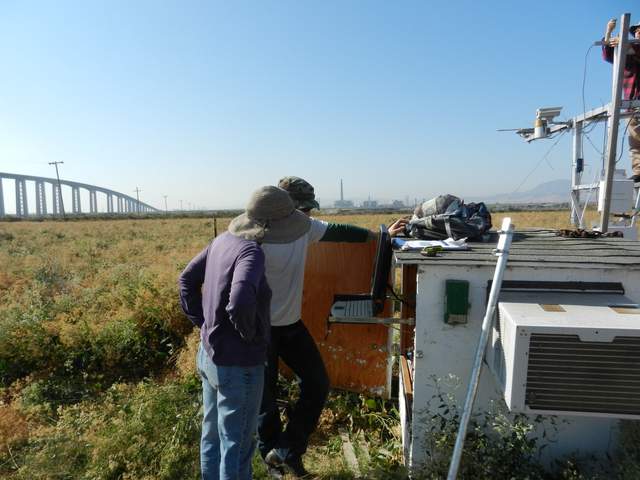
20120927SI_CoveLaurie.jpg ( 2012-09-27 10:06:29 ) Full size: 1920x1440
Cove and Laurie checking the data
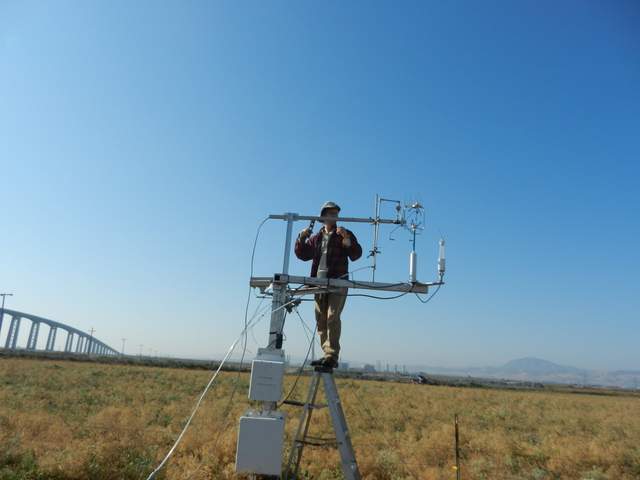
20120927SI_JoeATISonic1.jpg ( 2012-09-27 10:05:23 ) Full size: 1920x1440
Joe setting up an ATI sonic
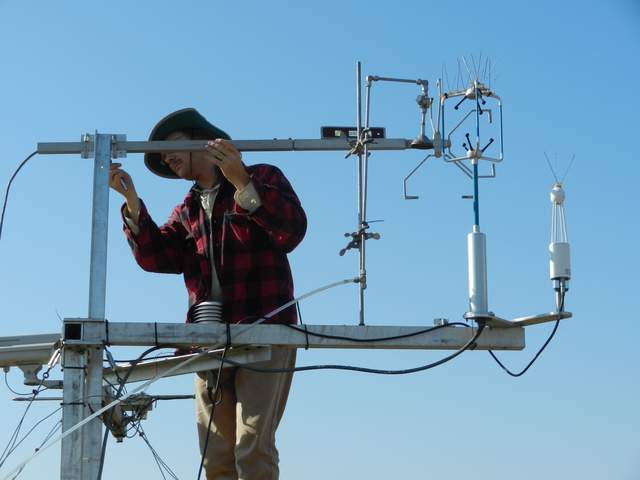
20120927SI_JoeATISonic2.jpg ( 2012-09-27 10:05:32 ) Full size: 1920x1440
Joe setting up an ATI sonic
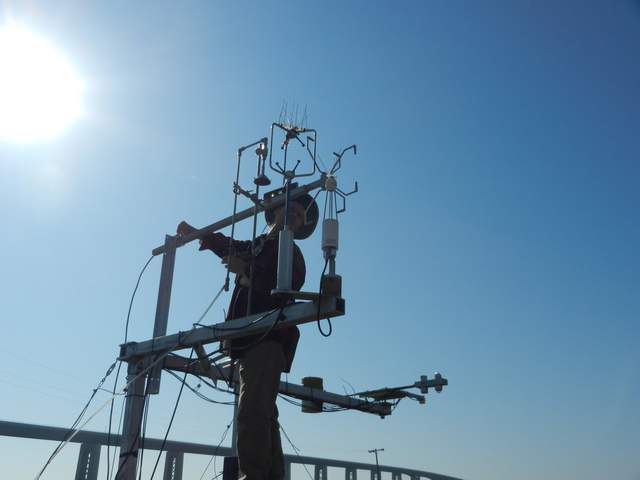
20120927SI_JoeATISonic3.jpg ( 2012-09-27 10:05:54 ) Full size: 1920x1440
Joe setting up an ATI sonic
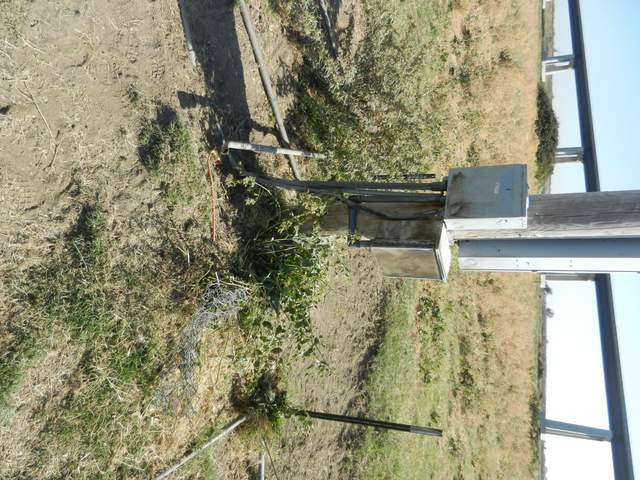
20120927SI_PowerPole.jpg ( 2012-09-27 10:32:35 ) Full size: 1920x1440
Cows are destroying the power boxes
SI_JoeConstructingATIMount.JPG ( 2012-09-27 09:40:51 ) Full size: 968x1296
Joe drilling holes in the ATI sonic mount
SI_JoeMountingATI.JPG ( 2012-09-27 10:03:11 ) Full size: 1296x968
Joe adding an ATI sonic to the Sherman pasture tower.
SI_JoeMountingATI2.JPG ( 2012-09-27 10:03:38 ) Full size: 1296x968
Joe adding an ATI sonic to the Sherman pasture tower.
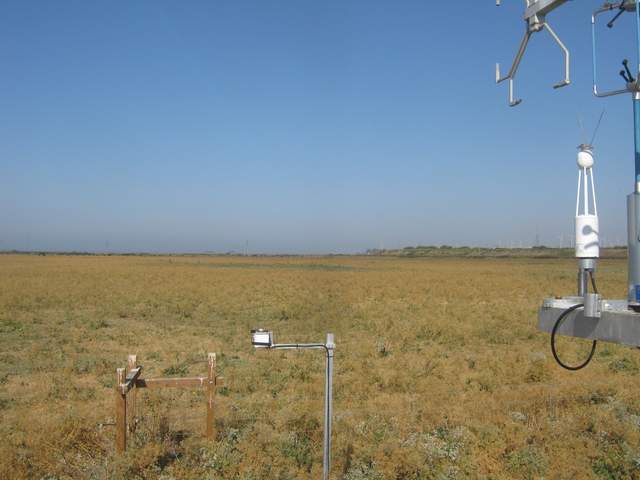
SI_autocam_20120927_0915.jpg ( 2012-09-27 09:15:02 ) Full size: 1920x1440
ATI sonic mounted
7 sets found
No data found for SI_mp.
11 SI_met graphs found
Can't check SI_mixed
2 SI_mixed graphs found
4 SI_flx graphs found
3 SI_soilco2 graphs found
Can't check TWSI_mixed
Can't check SIMBTWEE_met

