
Field Notes
<--2012-09-13 08:30:00 | 2012-09-27 09:15:00-->Other sites visited today: Twitchell Rice | DWR Corn | Mayberry | West Pond
Phenocam link: Searching...
Sherman Island: 2012-09-20 09:45:00 (DOY 264)
Author: Cove Sturtevant
Others: Sara, Laurie
Summary: Site in perpetual state of pepperweed, noted some NaNs in 10 Hz sonic data, Vaisala temp/RH close to standard
| Sherman
2012-09-20 We arrived about 09:45 PDT. Weather was sunny and breezy, about 18°C. The site continues to look exactly the same, dry pepperweed sprinkled with green pepperweed. Water by the road is still pretty high, but the field is dry. I checked the tower while Sara did moisture point, water well depth, and spectral. Laurie did LAI. LGR readings: 08:45, 24.25 °C, 129.56 Torr (adjusted to 147 Torr), 13.83 us, 10 Hz, 1.87 ppm, ch4_20120906_001.txt 7500 readings: CO2: 16.18 mmol m-3 H2O: 580 mmol m-3 T: 21.2 °C P: 101.7 kPa diag: 248 I noted that the CR1000 10 Hz numbers for the sonic and 7500 had some periodic NaNs flashing by. I have noticed this for the LGR data stream but never the sonic/7500. The WMP diag was 0, so I kept an eye on it and only saw a few NaNs flash by, but we should probably check the data to see if an increasing number of NaNs are entering the stream and dig a little deeper if warranted. MET and Soil CO2 looked good. We brought out the Vaisala temperature standard again this week and I kept it shaded until the point at which I replaced the tower Vaisala with it in the radiation shield. This time it settled more quickly, only a few minutes necessary. The numbers looked pretty right on. Here is the comparison: Standard: T = 18.8 °C; RH = 61% Tower probe: T = 18.38 °C before, 19.2 °C after; RH = 62.6% before, 60.5% after |
2 photos found
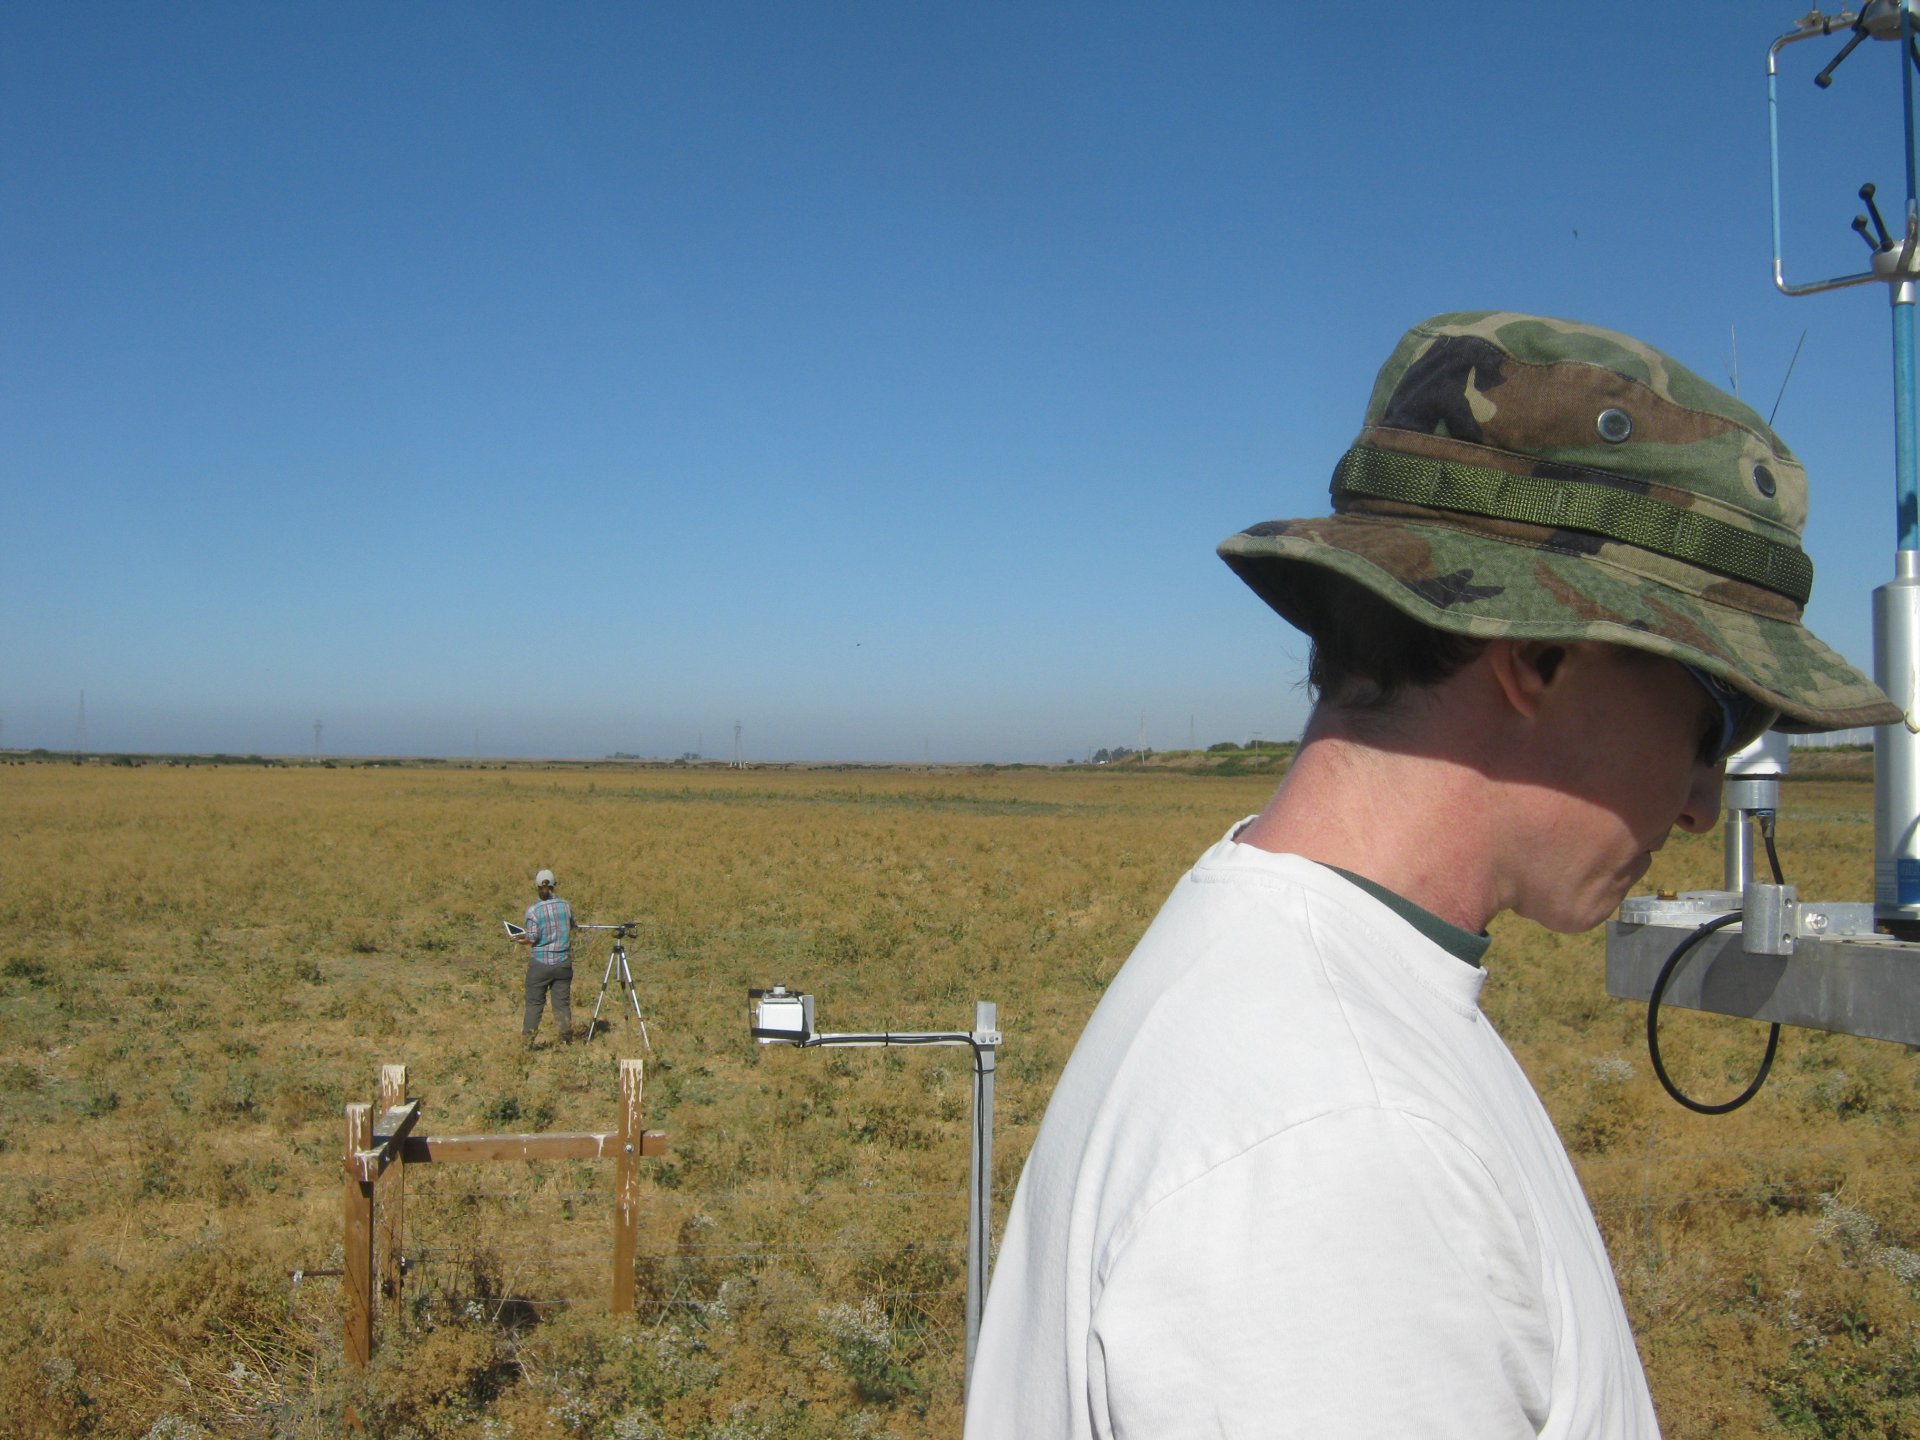
SI_autocam_20120920_0915.jpg ( 2012-09-20 09:15:02 ) Full size: 1920x1440
Cove and Sara on site
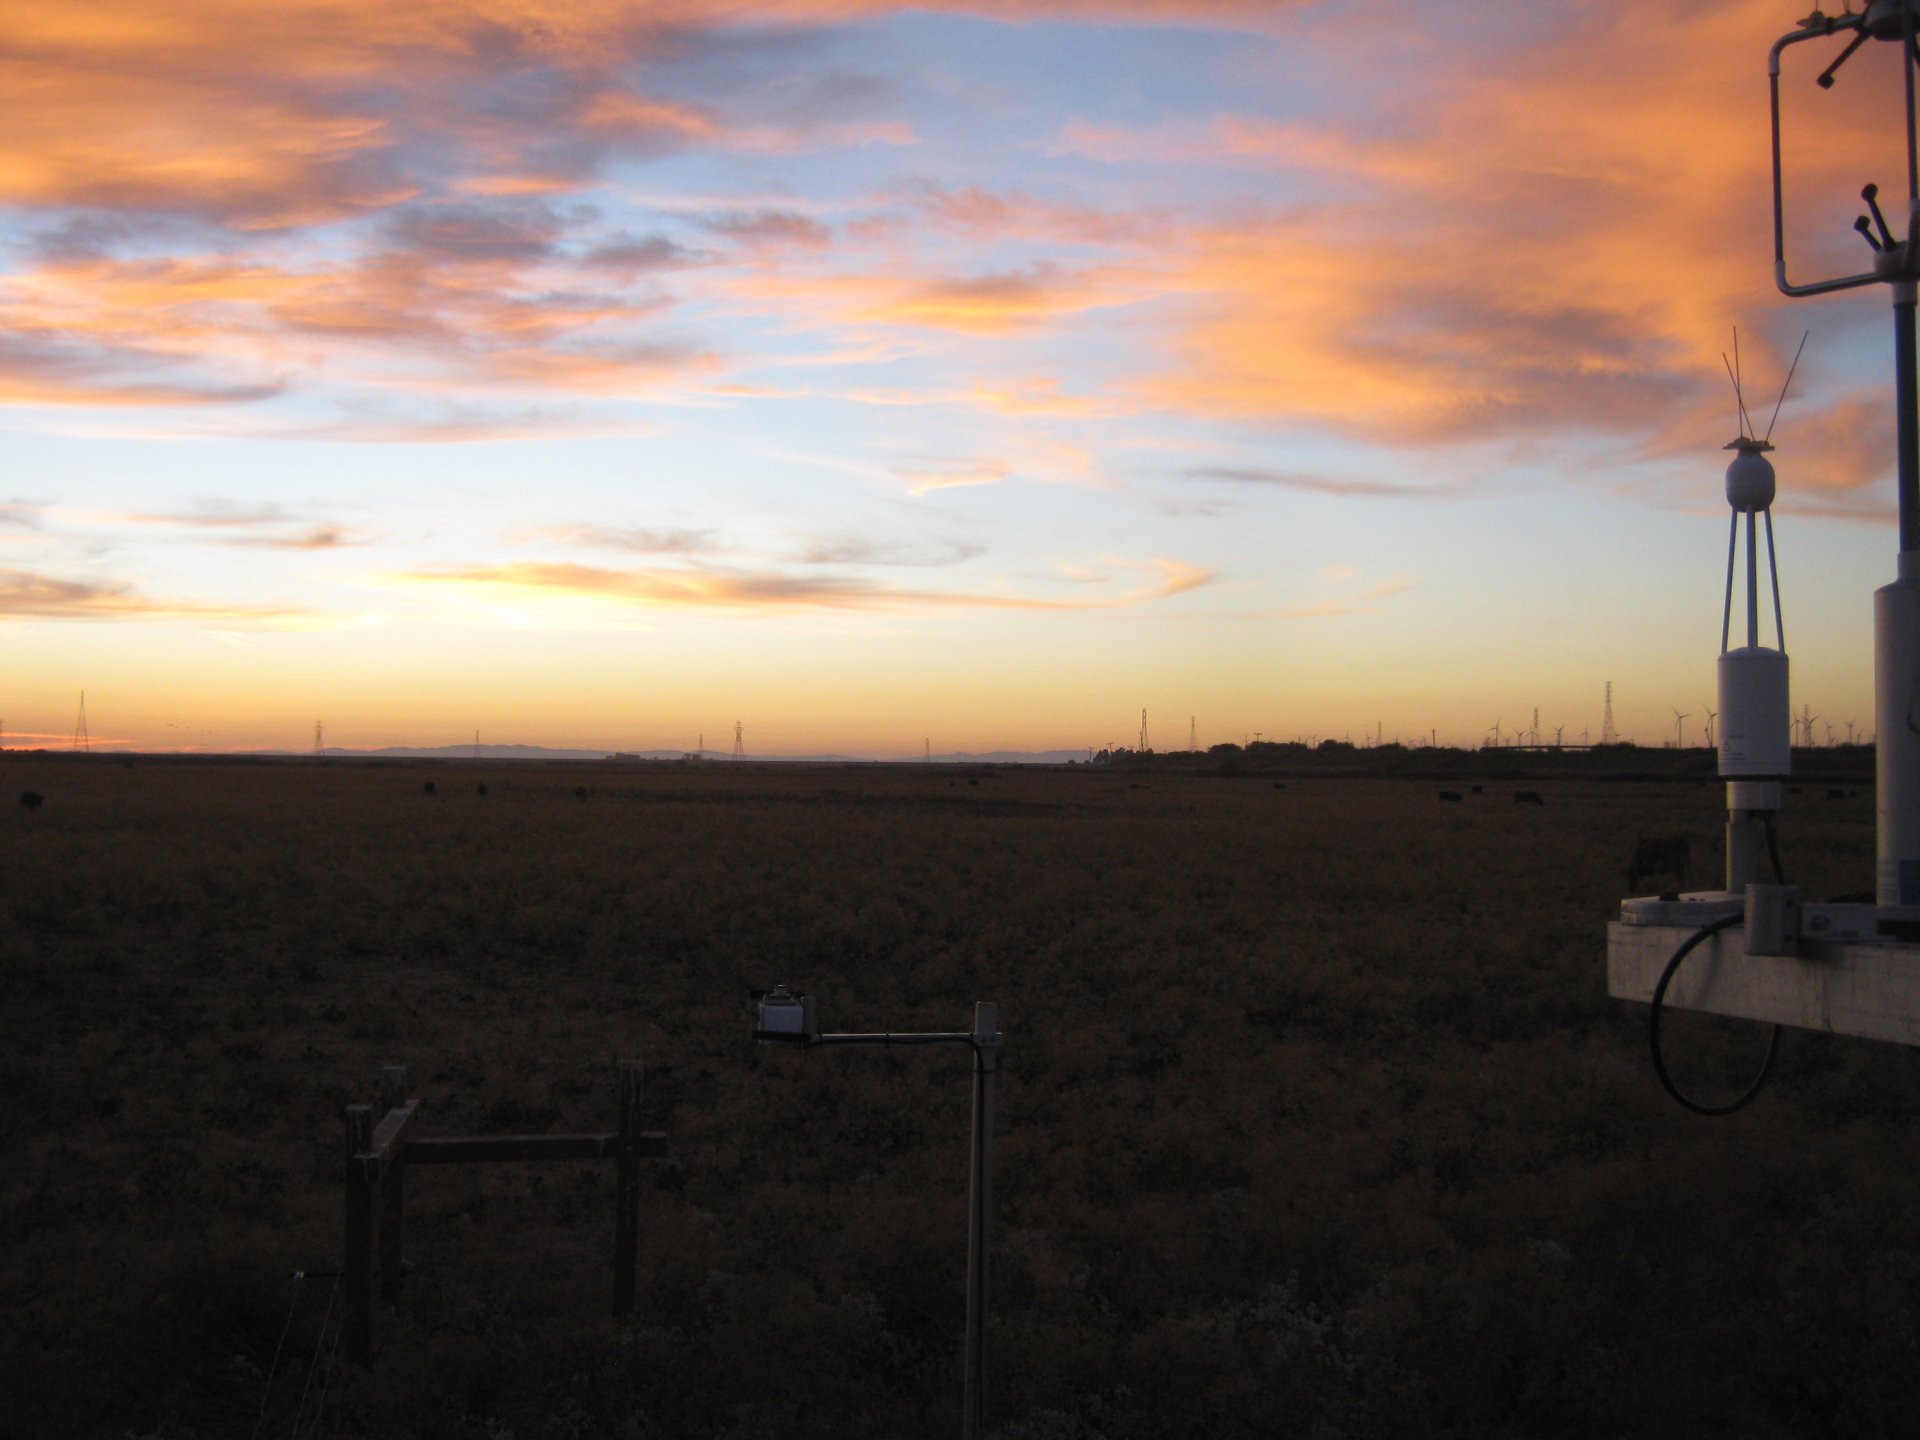
SI_autocam_20120921_1815.jpg ( 2012-09-21 18:15:03 ) Full size: 1920x1440
Nice sunset
7 sets found
No data found for SI_mp.
11 SI_met graphs found
Can't check SI_mixed
2 SI_mixed graphs found
4 SI_flx graphs found
3 SI_soilco2 graphs found
Can't check TWSI_mixed
Can't check SIMBTWEE_met