Field Notes

<--2012-04-23 11:00:00 | 2012-05-04 11:00:00-->
Other sites visited today: Vaira | Tonzi

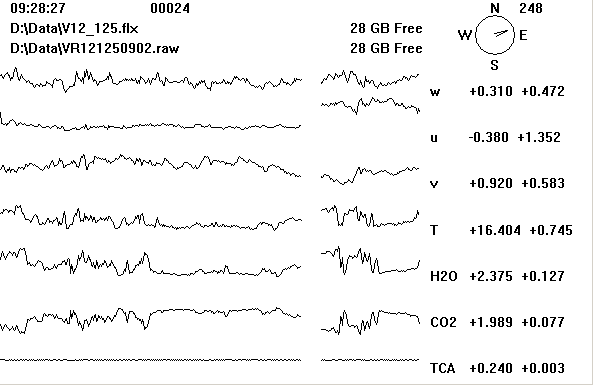
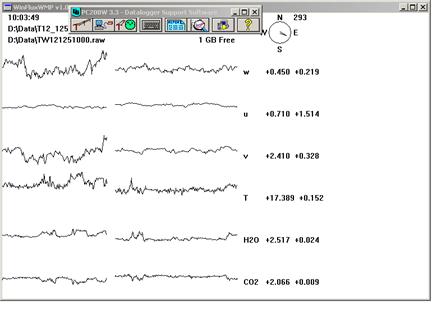
Tonzi: 2012-05-04 09:30:00 (DOY 125)
Author: Siyan Ma
Others: Joe, Chinese Visitors

Summary: Showing Chinese Visitors the site, standard fieldwork.


When: Date: 5/4/2012 , Day: 125 , Watch Time: 9:30 am .
Where: Tonzi/Vaira Ranch
Who: Siyan, Joe, and visitors from China; met Laurie at Tonzi. She was collecting soil samples for soil total C and N.
Weather: cloudy
Phenology: grasses started the development stage; oak leaves almost fully expanded.


Summary
  1. checked and downloaded data at Tower, Floor, and Vaira (Joe)
  2. Calibrated Li-800 in the field. (Joe)
  3. collect grass samples
  4. checked grass heights in the field (VR: 44 cm; TZ: 29 cm)
  5. Read dendrometers
  6. Measured soil moisture
  7. Measure groundwater well:

Date

DOY

Location

Depth without the black thing (feet)

5/4/2012

125

Floor

23.5


Tower

27.6


roadside

32.1

Vaira_Grass Site
  1. Fence and gate power: 12 v.
  2. Panel and Batteries: - v; - amps; - amps.
  3. Reading from Gillsonic screen before downloading data. (The value of H2O and CO2 should be in the range of 0 – 5 v.)

  1. downloading data
  2. Check the fans of air temp. and relative humidity sensors at Vaira. YES!
  3. Check MD-9 system connections YES!

  1. Check CR23X with two multiplexers: Worked well after Joe fixed the diffusion sensor.
  2. Check levels of Radiation sensors, clear up surfaces.YES! (Joe)
  3. Check rain gage, make sure not clogged. YES! (Joe)
  4. Closed gate and set up fence. YES!

Tonzi_Tower Site

  1. Fence and gate power: 12 v.
  2. Panel and Batteries: - v; - amps; - amps.
  3. Reading from Gillsonic screen before downloading data. (The value of H2O and CO2 should be in the range of 0 – 5 v.)

  1. downloading data YES!
  2. check the fans of air temp. and relative humidity sensors on the tower and the floor. YES!
  3. Check rain gage, make sure not clogged. YES!
  4. Check calibration cylinders;


  1. close gate and set up fence. YES!

Toniz_Floor Site
  1. Fence and gate power: 12 v.
  2. Panel and Batteries: - v; - amps; - amps. (about 7:00 am local time)
  3. Reading from Gillsonic screen before downloading data. (The value of H2O and CO2 should be in the range of 0 – 5 v.)

  1. downloading data YES!
  2. Check MD-9 system connections YES!

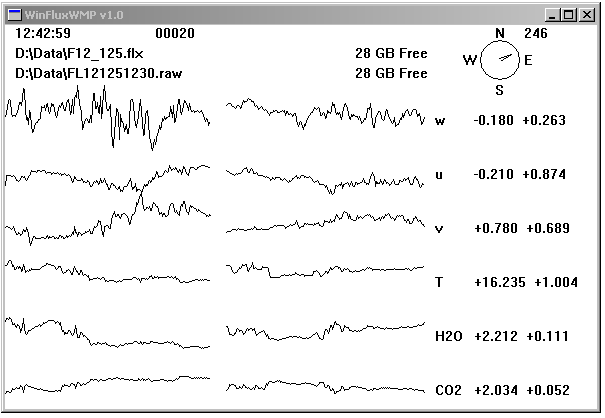
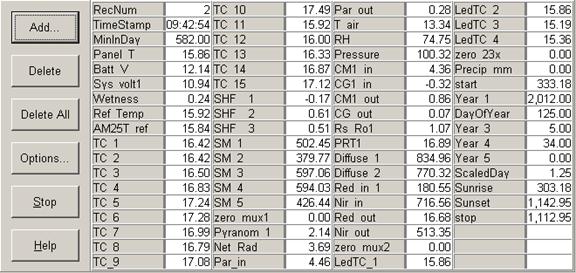
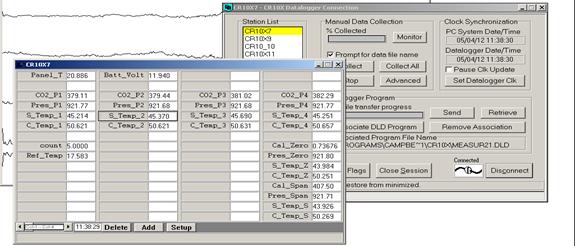
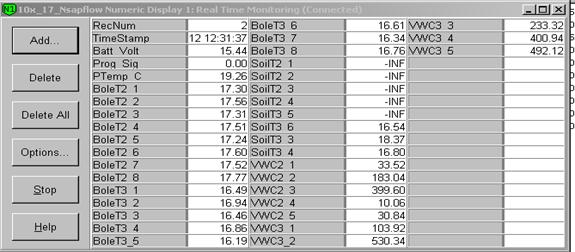
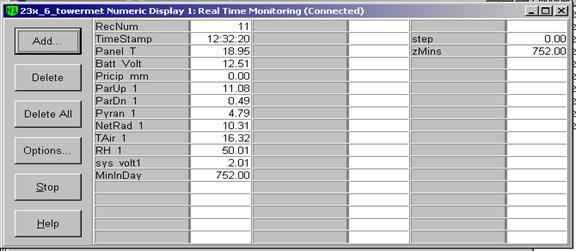
CR23X3 – floor-Met
CR23X5 – soil CO2 profile
CR23X6 – tower-Met
CR10X2 – floor-Met


  1. Soil CO2 profile:

  1. Close gate and set up fence. YES!


Tonzi


Dendrometer


Date

Day

Tag #

Reading (mm)


5/4/2012

125

72

10.5


79

9.3


102

12.0


245

9.5


250

X

(reset to 10.5 on May 7, 2009)


1

20.0


2

16.6


3

17.5


4

4.1


5

23.9


7

7.9

133


8

16.5

11828


71

X


77

X


78

X


248

X

broken


255

X


‌252‌

X


6

X


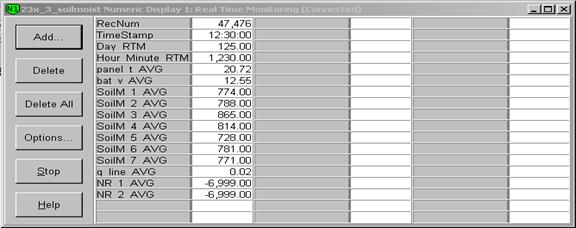
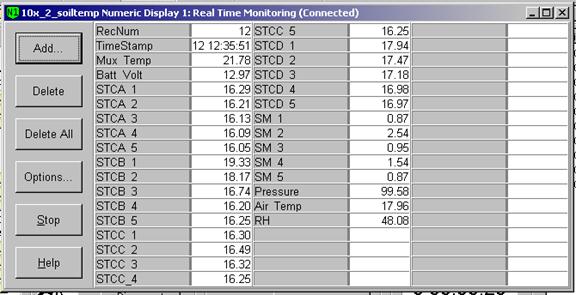
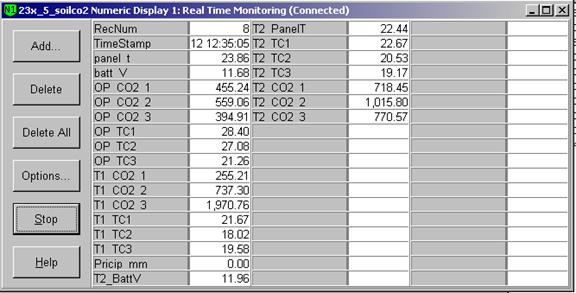
Notes: “X” means not working any more.

tonzi

7931AFE

402165

574B4B

402FF3

574632

7A432E

7A3C6E

7A3B40

7A4AAA

5/4/2012

125


sm


0-15

31.7

18.2

32.0

20.3

31.5

23.8

17.6

19.1

13.2

15-30

32.5

28.6

30.4

34.4

31.3

20.8

25.5

27.1

14.2

30-45

40.7

42.4

40.7

44.4

63.9

24.5

26.2

29.9

28.8

45-60

38.2

57.7

68.0

54.0

11.1

30.2

41.1

47.1

26.2


A6D882B

A3D04E8

A6D72F5


0-15

21.7

20.3

19.7


15-30

22.5

10.3

29.5


30-45

31.8

30.1

35.4


45-60

42.5

48.6

49.7


vaira

57318a

7933dee

00000128B97F3

00000128B8072

00000128BDDE8


0-15

broken

12.3

16.05

6.7

4.5


15-30

broken

21.3

22.05

9.2

16.4


30-45

broken

23.4

10.9

16.2

22.9


45-60

broken

37.2

22.35

13.1

25.4


Field Data

No tank data

Well Depth

DateLocationDepth (feet)
2012-05-04TZ_floor23.5
2012-05-04TZ_road32.1
2012-05-04TZ_tower27.6

No TZ Moisture Point data found

No VR Moisture Point data found

No TZ grass heigth found

No VR grass heigth found

Tree DBH

DateTag#Reading (mm)
2012-05-04120
2012-05-0410212
2012-05-04216.6
2012-05-042459.5
2012-05-04317.5
2012-05-0444.1
2012-05-04523.9
2012-05-0477.9
2012-05-047210.5
2012-05-04799.3
2012-05-04816.5

No water potential data found

No TZ Grass Biomass data found

No TZ OakLeaves Biomass data found

No TZ PineNeedles Biomass data found

0 photos found

Graphs display:
16 sets found

No data found for TZ_Fenergy.
11 TZ_tmet graphs found

Explore the graph:Tonzi Tower Met: Temperature and Power in a new window

Explore the graph:Tonzi Tower Met: Solar Radiation in a new window

Explore the graph:Tonzi Tower Met: IRT Sensors in a new window

Explore the graph:LED Sensor Incoming in a new window

Explore the graph:LED Sensor Outgoing in a new window

Explore the graph:4-Band Solar Radiation in a new window

Explore the graph:Air Temperature Profile in a new window

Explore the graph:Relativity Humidity Profile in a new window

Explore the graph:Tonzi Tower PRI in a new window

Explore the graph:SRS PRI/NDVI in a new window

Explore the graph:SRS NDVI in a new window

11 TZ_soilco2 graphs found

Explore the graph:Tonzi Soil CO2 Profile: Open (East) CO2 in a new window

Explore the graph:Tonzi Soil CO2 Profile: Tree (West) CO2 in a new window

Explore the graph:Tonzi Soil CO2 Profile: Open (East) Temperatures in a new window

Explore the graph:Tonzi Soil CO2 Profile: Tree (West) Temperatures in a new window

Explore the graph:Tonzi Soil CO2 Profile: Upper CO2 in a new window

Explore the graph:Tonzi Soil CO2 Profile: Lower CO2 in a new window

Explore the graph:Tonzi Soil CO2 Profile: Upper Temperatures in a new window

Explore the graph:Tonzi Soil CO2 Profile: Lower Temperatures in a new window

Explore the graph:Tonzi Soil CO2 Profile: Power and Temperature in a new window

Explore the graph:Tree 2 Soil CO2 in a new window

Explore the graph:Tree 2 Soil Temperature in a new window

Can't check TZ_mixed
3 TZ_mixed graphs found

Explore the graph:Tonzi PPT in a new window

Explore the graph:Tonzi CO2 and H2O Densities in a new window

Explore the graph:Air Pressure in a new window

1 TZ_fflux graphs found

Explore the graph:Tonzi Wind Speed in a new window

8 TZ_fmet graphs found

Explore the graph:Soil Heat Flux in a new window

Explore the graph:Tonzi Soil Temperature Set A in a new window

Explore the graph:Tonzi Soil Temperatures Set B in a new window

Explore the graph:Tonzi Soil Temperatures Set C in a new window

Explore the graph:Tonzi Soil Temperature Set D in a new window

Explore the graph:Well Level in a new window

Explore the graph:Well Water Temperature in a new window

Explore the graph:Soil Water Potential in a new window

1 TZ_tram graphs found

Explore the graph:Tonzi Tram Incoming PAR in a new window

3 TZ_co2prof graphs found

Explore the graph:Tower CO2 Profile Concentrations in a new window

Explore the graph:Tower CO2 Profile Cell Pressure in a new window

Explore the graph:CO2 Profile Sensor Temperature in a new window

No data found for TZ_irt.
No data found for TZ_windprof.
1 TZ_tflux graphs found

Explore the graph:Tower CO2 and H2O in a new window

2 TZ_sm graphs found

Explore the graph:Floor Solar Radiations in a new window

Explore the graph:TZ Soil Moisture in a new window

Can't check TZ_met
1 TZ_met graphs found

Explore the graph:Floor and Tower RH in a new window

Can't check TZVR_mixed
8 TZ_osu graphs found

Explore the graph:Soil Moisture And Rain in a new window

Explore the graph:SP1 Solar Radiation in a new window

Explore the graph:SP1 Soil Temperature Profile in a new window

Explore the graph:SP1 Soil Heat Flux in a new window

Explore the graph:SP2 Soil Moisture in a new window

Explore the graph:SP2 Soil Temperature in a new window

Explore the graph:SP3 Soil Moisture in a new window

Explore the graph:SP3 Soil Temperature in a new window

No data found for TZ_fd.
Tonzi Z-cam data

plot of Tonzi z-cam LAI

plot of Tonzi z-cam gap fration