Field Notes
<--2012-04-23 08:30:00 | 2012-05-24 11:30:00-->Other sites visited today: Tonzi | Tonzi
Phenocam link: Searching...
Vaira: 2012-05-04 09:30:00 (DOY 125)
Author: Joe Verfaillie
Others: Siyan, Chinese Visitors
Summary: Chinese visitors, computer bobble, fixed CNR1 CM3 in.
| Vaira
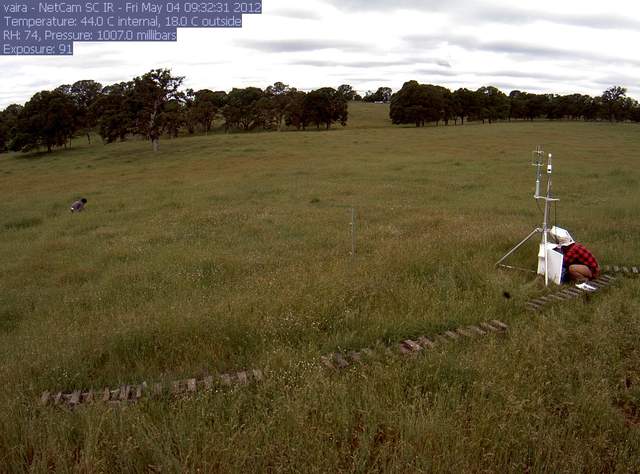
2012-05-04 I arrived about 9:30 with Siyan and her visitors from China. It was cool and overcast with little wind, but the overcast was breaking up. The water hole is still full and the first puddle on the road still has water but the second puddle was dry. I pulled some weeds around the solar panels and the ground was still wet. There was dew on the grass. Seems like more clover this year. When we arrived the computer seemed to be having problems. The screen would not come up and it seemed it was trying to reboot. The solar power was good: 12.6V, 14.7A solar, 4.0A load. I ended up disconnecting the internal fan that was blowing at full speed to try to hear if the hard drive was running. After disconnecting the fan the computer seemed to run fine. Also, there didn’t seem to be any data lost. I swapped the wires for the CM3 incoming sensor on the CNR1 that were in backwards. I downloaded data from the soil co2 data logger. |
Field Data
No tank data
Well Depth
| Date | Location | Depth (feet) |
|---|---|---|
| 2012-05-04 | TZ_floor | 23.5 |
| 2012-05-04 | TZ_road | 32.1 |
| 2012-05-04 | TZ_tower | 27.6 |
No TZ Moisture Point data found
No VR Moisture Point data found
No TZ grass heigth found
No VR grass heigth found
No VR Tree DBH found
No water potential data found
No VR Grass Biomass data found
No VR OakLeaves Biomass data found
No VR PineNeedles Biomass data found
1 photos found

vaira_2012_05_04_093301.jpg ( 2012-05-04 09:30:56 ) Full size: 1296x960
Site visit - Joe, Siyan
9 sets found
16 VR_met graphs found
2 VR_flux graphs found
6 VR_soilco2 graphs found
No data found for VR_pond.
Can't check TZVR_mixed
No data found for VR_fd.
No data found for VR_processed.
No data found for VR_arable.
No data found for VR_soilvue.

