Field Notes

<--2012-04-19 11:30:00 | 2012-05-04 09:30:00-->
Other sites visited today: Vaira
Phenocam link: Searching...

Tonzi: 2012-04-23 11:00:00 (DOY 114)
Author: Joe Verfaillie
Others:

Summary: CO2 profile still limping along, fixed soil co2 system.

Tonzi
2012-04-23

I arrive about 11:00PDT. It was warm and mostly sunny, the morning clouds having mostly blown off to the west. It is dryer here too with the puddles in the road largely gone.

I checked on the CO2 profile system on the tower. The solenoid for the fourth, top location is still sticking but now badly. The pump lugs down a little at first, but by the time the measurements are made the pressure in the cell is fine. I’ll get a replacement better prepared and tested in the lab for another time.

The tram was running.

I replaced the power supplies for the CR23X and CR10X that run the soil CO2 measurements. The CR10X was still getting strange readings on the last CO2 channel. Finally I looked inside the transmitter and discovered it was mis-wired. Instead of 0 and mA the signal line was connected between the 0 and V. I’m not sure of all the implications but after fixing this things seemed much better. I reconnected the CR10X to the CR23X by SDM and all the data were being captured by the CR23X.

The readings from the tree two co2 sensors were:
Probe, co2, mV
1, 3820ppm, 916.48
2, 4150ppm, 999.59
3, 1.24%, 987.52

The probe three resistor is 120.9 Ohms.

Sensors at the tower top were clean. The floor HMP45 fan is dead. Data on both computers looked okay.

Field Data

No tank data

No TZ Well data found

No TZ Moisture Point data found

No VR Moisture Point data found

No TZ grass heigth found

No VR grass heigth found

No TZ Tree DBH found

No water potential data found

No TZ Grass Biomass data found

No TZ OakLeaves Biomass data found

No TZ PineNeedles Biomass data found

7 photos found
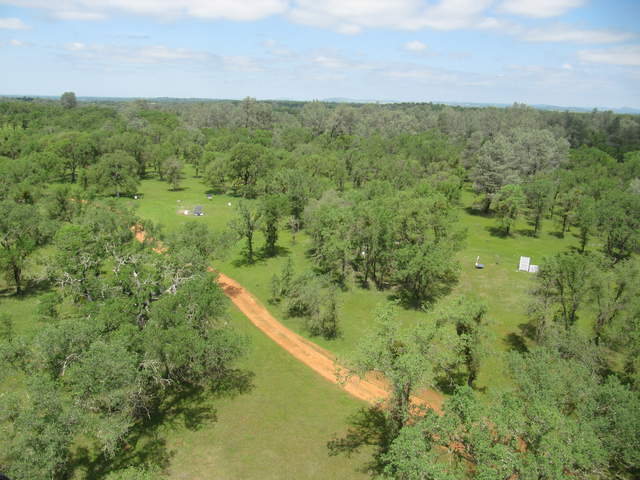
View of dirt road through green woodland from tower top
20120423TZ_FloorSoilCO2View.jpg ( 2012-04-23 12:33:33 ) Full size: 4000x3000
View of dirt road through green woodland from tower top
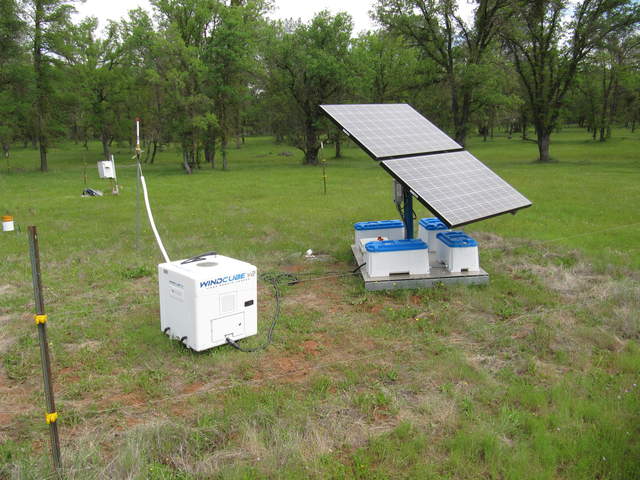
Vertical wind profiler and solar panels
20120423TZ_LidarSystem.jpg ( 2012-04-23 12:16:20 ) Full size: 4000x3000
Vertical wind profiler and solar panels
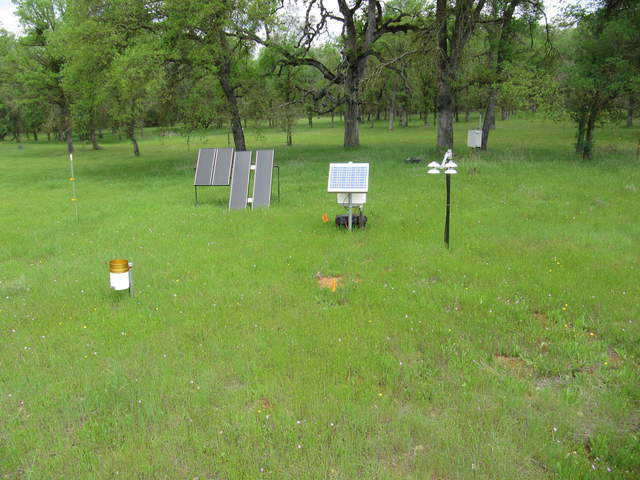
Green grass at OSU AirMOSS site one
20120423TZ_OSUSite1.jpg ( 2012-04-23 12:10:25 ) Full size: 4000x3000
Green grass at OSU AirMOSS site one
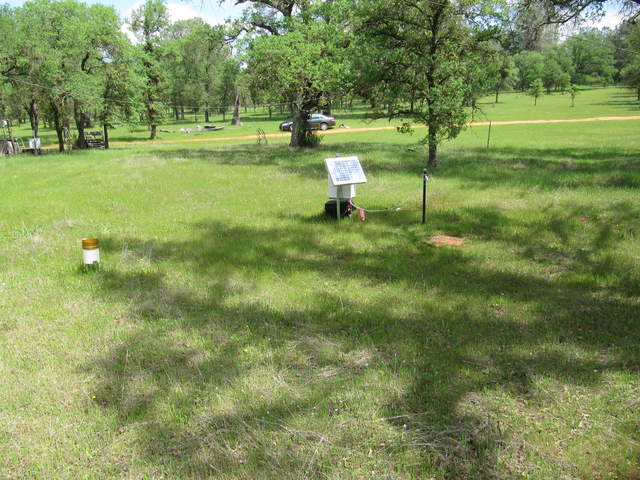
Green grass at OSU AirMOSS site two
20120423TZ_OSUSite2.jpg ( 2012-04-23 12:36:42 ) Full size: 4000x3000
Green grass at OSU AirMOSS site two
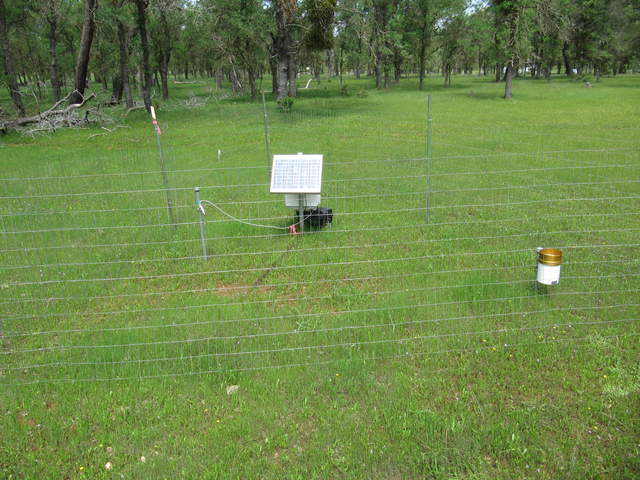
Green grass at OSU AirMOSS site three
20120423TZ_OSUSite3.jpg ( 2012-04-23 12:39:20 ) Full size: 4000x3000
Green grass at OSU AirMOSS site three
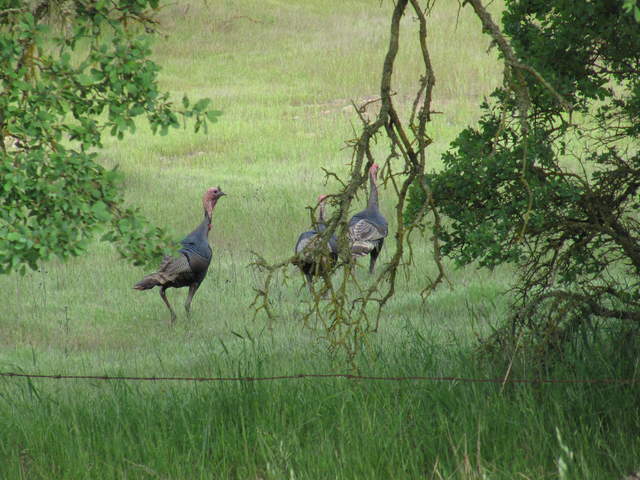
Turkeys running away
20120423TZ_Turkeys.jpg ( 2012-04-23 08:03:55 ) Full size: 4000x3000
Turkeys running away
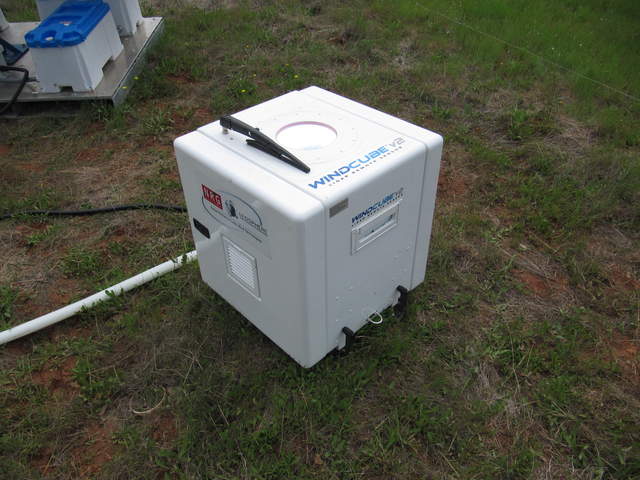
Wind Cube Lidar wind profiler
20120423TZ_WindProfileLidar.jpg ( 2012-04-23 12:16:01 ) Full size: 4000x3000
Wind Cube Lidar wind profiler

Graphs display:
16 sets found

No data found for TZ_Fenergy.
11 TZ_tmet graphs found

Explore the graph:Tonzi Tower Met: Temperature and Power in a new window

Explore the graph:Tonzi Tower Met: Solar Radiation in a new window

Explore the graph:Tonzi Tower Met: IRT Sensors in a new window

Explore the graph:LED Sensor Incoming in a new window

Explore the graph:LED Sensor Outgoing in a new window

Explore the graph:4-Band Solar Radiation in a new window

Explore the graph:Air Temperature Profile in a new window

Explore the graph:Relativity Humidity Profile in a new window

Explore the graph:Tonzi Tower PRI in a new window

Explore the graph:SRS PRI/NDVI in a new window

Explore the graph:SRS NDVI in a new window

11 TZ_soilco2 graphs found

Explore the graph:Tonzi Soil CO2 Profile: Open (East) CO2 in a new window

Explore the graph:Tonzi Soil CO2 Profile: Tree (West) CO2 in a new window

Explore the graph:Tonzi Soil CO2 Profile: Open (East) Temperatures in a new window

Explore the graph:Tonzi Soil CO2 Profile: Tree (West) Temperatures in a new window

Explore the graph:Tonzi Soil CO2 Profile: Upper CO2 in a new window

Explore the graph:Tonzi Soil CO2 Profile: Lower CO2 in a new window

Explore the graph:Tonzi Soil CO2 Profile: Upper Temperatures in a new window

Explore the graph:Tonzi Soil CO2 Profile: Lower Temperatures in a new window

Explore the graph:Tonzi Soil CO2 Profile: Power and Temperature in a new window

Explore the graph:Tree 2 Soil CO2 in a new window

Explore the graph:Tree 2 Soil Temperature in a new window

Can't check TZ_mixed
3 TZ_mixed graphs found

Explore the graph:Tonzi PPT in a new window

Explore the graph:Tonzi CO2 and H2O Densities in a new window

Explore the graph:Air Pressure in a new window

1 TZ_fflux graphs found

Explore the graph:Tonzi Wind Speed in a new window

8 TZ_fmet graphs found

Explore the graph:Soil Heat Flux in a new window

Explore the graph:Tonzi Soil Temperature Set A in a new window

Explore the graph:Tonzi Soil Temperatures Set B in a new window

Explore the graph:Tonzi Soil Temperatures Set C in a new window

Explore the graph:Tonzi Soil Temperature Set D in a new window

Explore the graph:Well Level in a new window

Explore the graph:Well Water Temperature in a new window

Explore the graph:Soil Water Potential in a new window

1 TZ_tram graphs found

Explore the graph:Tonzi Tram Incoming PAR in a new window

3 TZ_co2prof graphs found

Explore the graph:Tower CO2 Profile Concentrations in a new window

Explore the graph:Tower CO2 Profile Cell Pressure in a new window

Explore the graph:CO2 Profile Sensor Temperature in a new window

No data found for TZ_irt.
No data found for TZ_windprof.
1 TZ_tflux graphs found

Explore the graph:Tower CO2 and H2O in a new window

2 TZ_sm graphs found

Explore the graph:Floor Solar Radiations in a new window

Explore the graph:TZ Soil Moisture in a new window

Can't check TZ_met
1 TZ_met graphs found

Explore the graph:Floor and Tower RH in a new window

Can't check TZVR_mixed
8 TZ_osu graphs found

Explore the graph:Soil Moisture And Rain in a new window

Explore the graph:SP1 Solar Radiation in a new window

Explore the graph:SP1 Soil Temperature Profile in a new window

Explore the graph:SP1 Soil Heat Flux in a new window

Explore the graph:SP2 Soil Moisture in a new window

Explore the graph:SP2 Soil Temperature in a new window

Explore the graph:SP3 Soil Moisture in a new window

Explore the graph:SP3 Soil Temperature in a new window

No data found for TZ_fd.
Tonzi Z-cam data

plot of Tonzi z-cam LAI

plot of Tonzi z-cam gap fration