Field Notes
<--2011-03-08 15:00:00 | 2011-04-13 12:00:00-->Other sites visited today: Twitchell Rice | Sherman Island
Phenocam link: Searching...
Mayberry: 2011-03-22 11:30:00 (DOY 81)
Author: Joe Verfaillie
Others: Dennis, Jaclyn, Emily
Summary: Tule tower tilted in wind - fixed, grounding fixed, Tule tower TCs fixed, pH probe install but maxed out.
| Mayberry
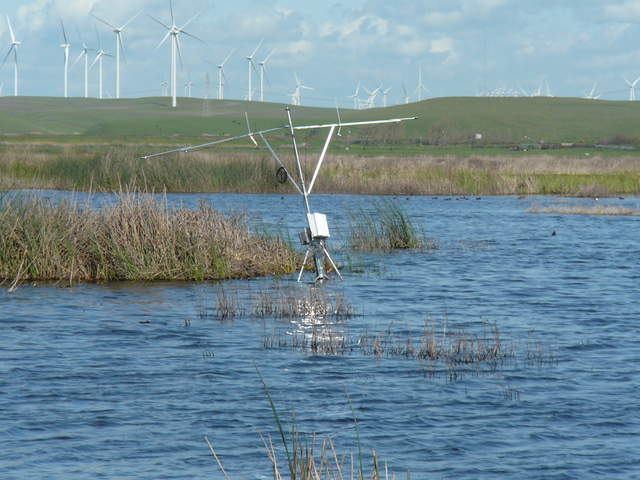
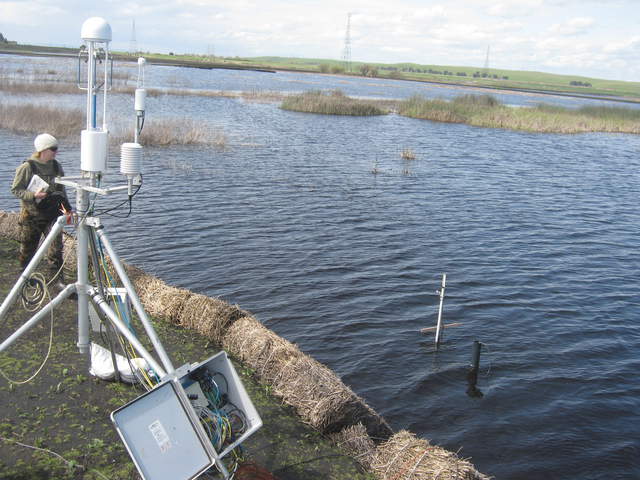
2011-03-22 I arrived at Mayberry about 11:30 with Dennis, Jaclyn and Emily. It was mostly sunny with a wind from the east. More clouds moved in from the southeast and it felt colder as the afternoon progressed. The check to the south of the tower seemed lower in water, but no obvious change in water level in our section. A lot more green tules and cat tails are visible. Tules are coming up through the water around the tule tower. The wind had blown hard enough to tilt the new tule tower a little to the west. I straightened the fence post anchor and tighten the bolt on the tripod leg to the north that had slipped. I repositioned the tower and attached it to the fence post with two pipe clamps. The radiometers were still pretty level. Looks like birds had stood on the upward PAR sensor. Jaclyn worked on putting the thermocouples on larger dowels and we put a number into the ground with a guide and pilot hole. But some thermocouples were broken and we gave up on the last. The plan is to rebuild a set at a time in the lab and swap them out. I fixed the grounding wires on the CR10X and multiplexors at the tule tower. I collected the data from the tule tower on the field netbook. I ran a two conductor wire from the tule tower to the main tower in preparation to try a SDI connection. At the main tower the wind had blown the camera over to the west. The camera had lost power, but started up fine. I swapped the card. We swapped the card on the CR1000 and collected data from the 23x. Jaclyn cleaned the mirrors on the LI7700. The RSSI went from about 30 to almost 90. Dennis refilled the Li7700 was reservoir with DI water. Jaclyn hooked up the pH probe again and it gave a max reading. We tested it in some of the DI water and it was fine. Seems something in the wetland water is maxing it out. We took a sample of the wetland water for investigation in the lab. |
2 photos found

20110322MB_WindTiltedTuleTower.jpg ( 2011-03-22 10:48:11 ) Full size: 2560x1920
Wind tilted the tule tower

MB_autocam_20110322_1245.jpg ( 2011-03-22 12:45:02 ) Full size: 3648x2736
Jaclyn on site
11 sets found
7 MB_flux graphs found
5 MB_met graphs found
27 MB_tule graphs found
Can't check MBWPEESWGT_mixed
1 MB_cam graphs found
Can't check MBEEWPSWEPGT_cam
Can't check SIMBTWEE_met
No data found for MB_minidot.
Can't check MBSWEEWPBCBA
1 MB_processed graphs found
Can't check MB_fd
1 MB_fd graphs found

