Field Notes

<--2011-03-22 11:30:00 | 2011-04-15 09:00:00-->
Other sites visited today: Sherman Island | Twitchell Rice
Phenocam link: Searching...

Mayberry: 2011-04-13 12:00:00 (DOY 103)
Author: Joe Verfaillie
Others: Jaclyn, Gavin

Summary: Downloaded data, filled LI7700 wash reservoir, autocam off - restarted, removed pH sensor, sonic data missing.

Mayberry
4/13/2011

I arrived about 12:00PDT with Jaclyn and Gavin. There was quite a bit more green tules and cat tails showing. The water looked higher, but the marks on the well indicated that it had been higher previously. Lots of weeds beginning to grow on the levees in some places. It was mostly sunny with a strong wind from the west southwest.

Jaclyn and Gavin went out to the Tule Tower and downloaded the data.

The auto camera was off, but the battery was above 13V. Images quit only two days after our last visit so we lost most of the images. It might be worth tying the camera into the main solar system.

I cleaned the LI7700 mirrors – RSSI was 88 afterwards. The top mirror had water spots along the edges. The washer reservoir was empty again. I filled the reservoir and will adjust the cleaning cycle next time out.

I collected data from the 23x and swapped cards on the camera and CR1000.

The pH sensor was still off the charts so we pulled it out. It was covered with algae and egg sacks. The conductivity sensor was likewise fouled. Jaclyn cleaned the conductivity sensor with a rag, but it need better cleaning next time.

Examination for CR1000 data showed that the sonic data did not get saved since a couple hours since our last visit. I’m sure it was okay in Loggernet, but it did not get on to the CFM card.

5 photos found

Autocam
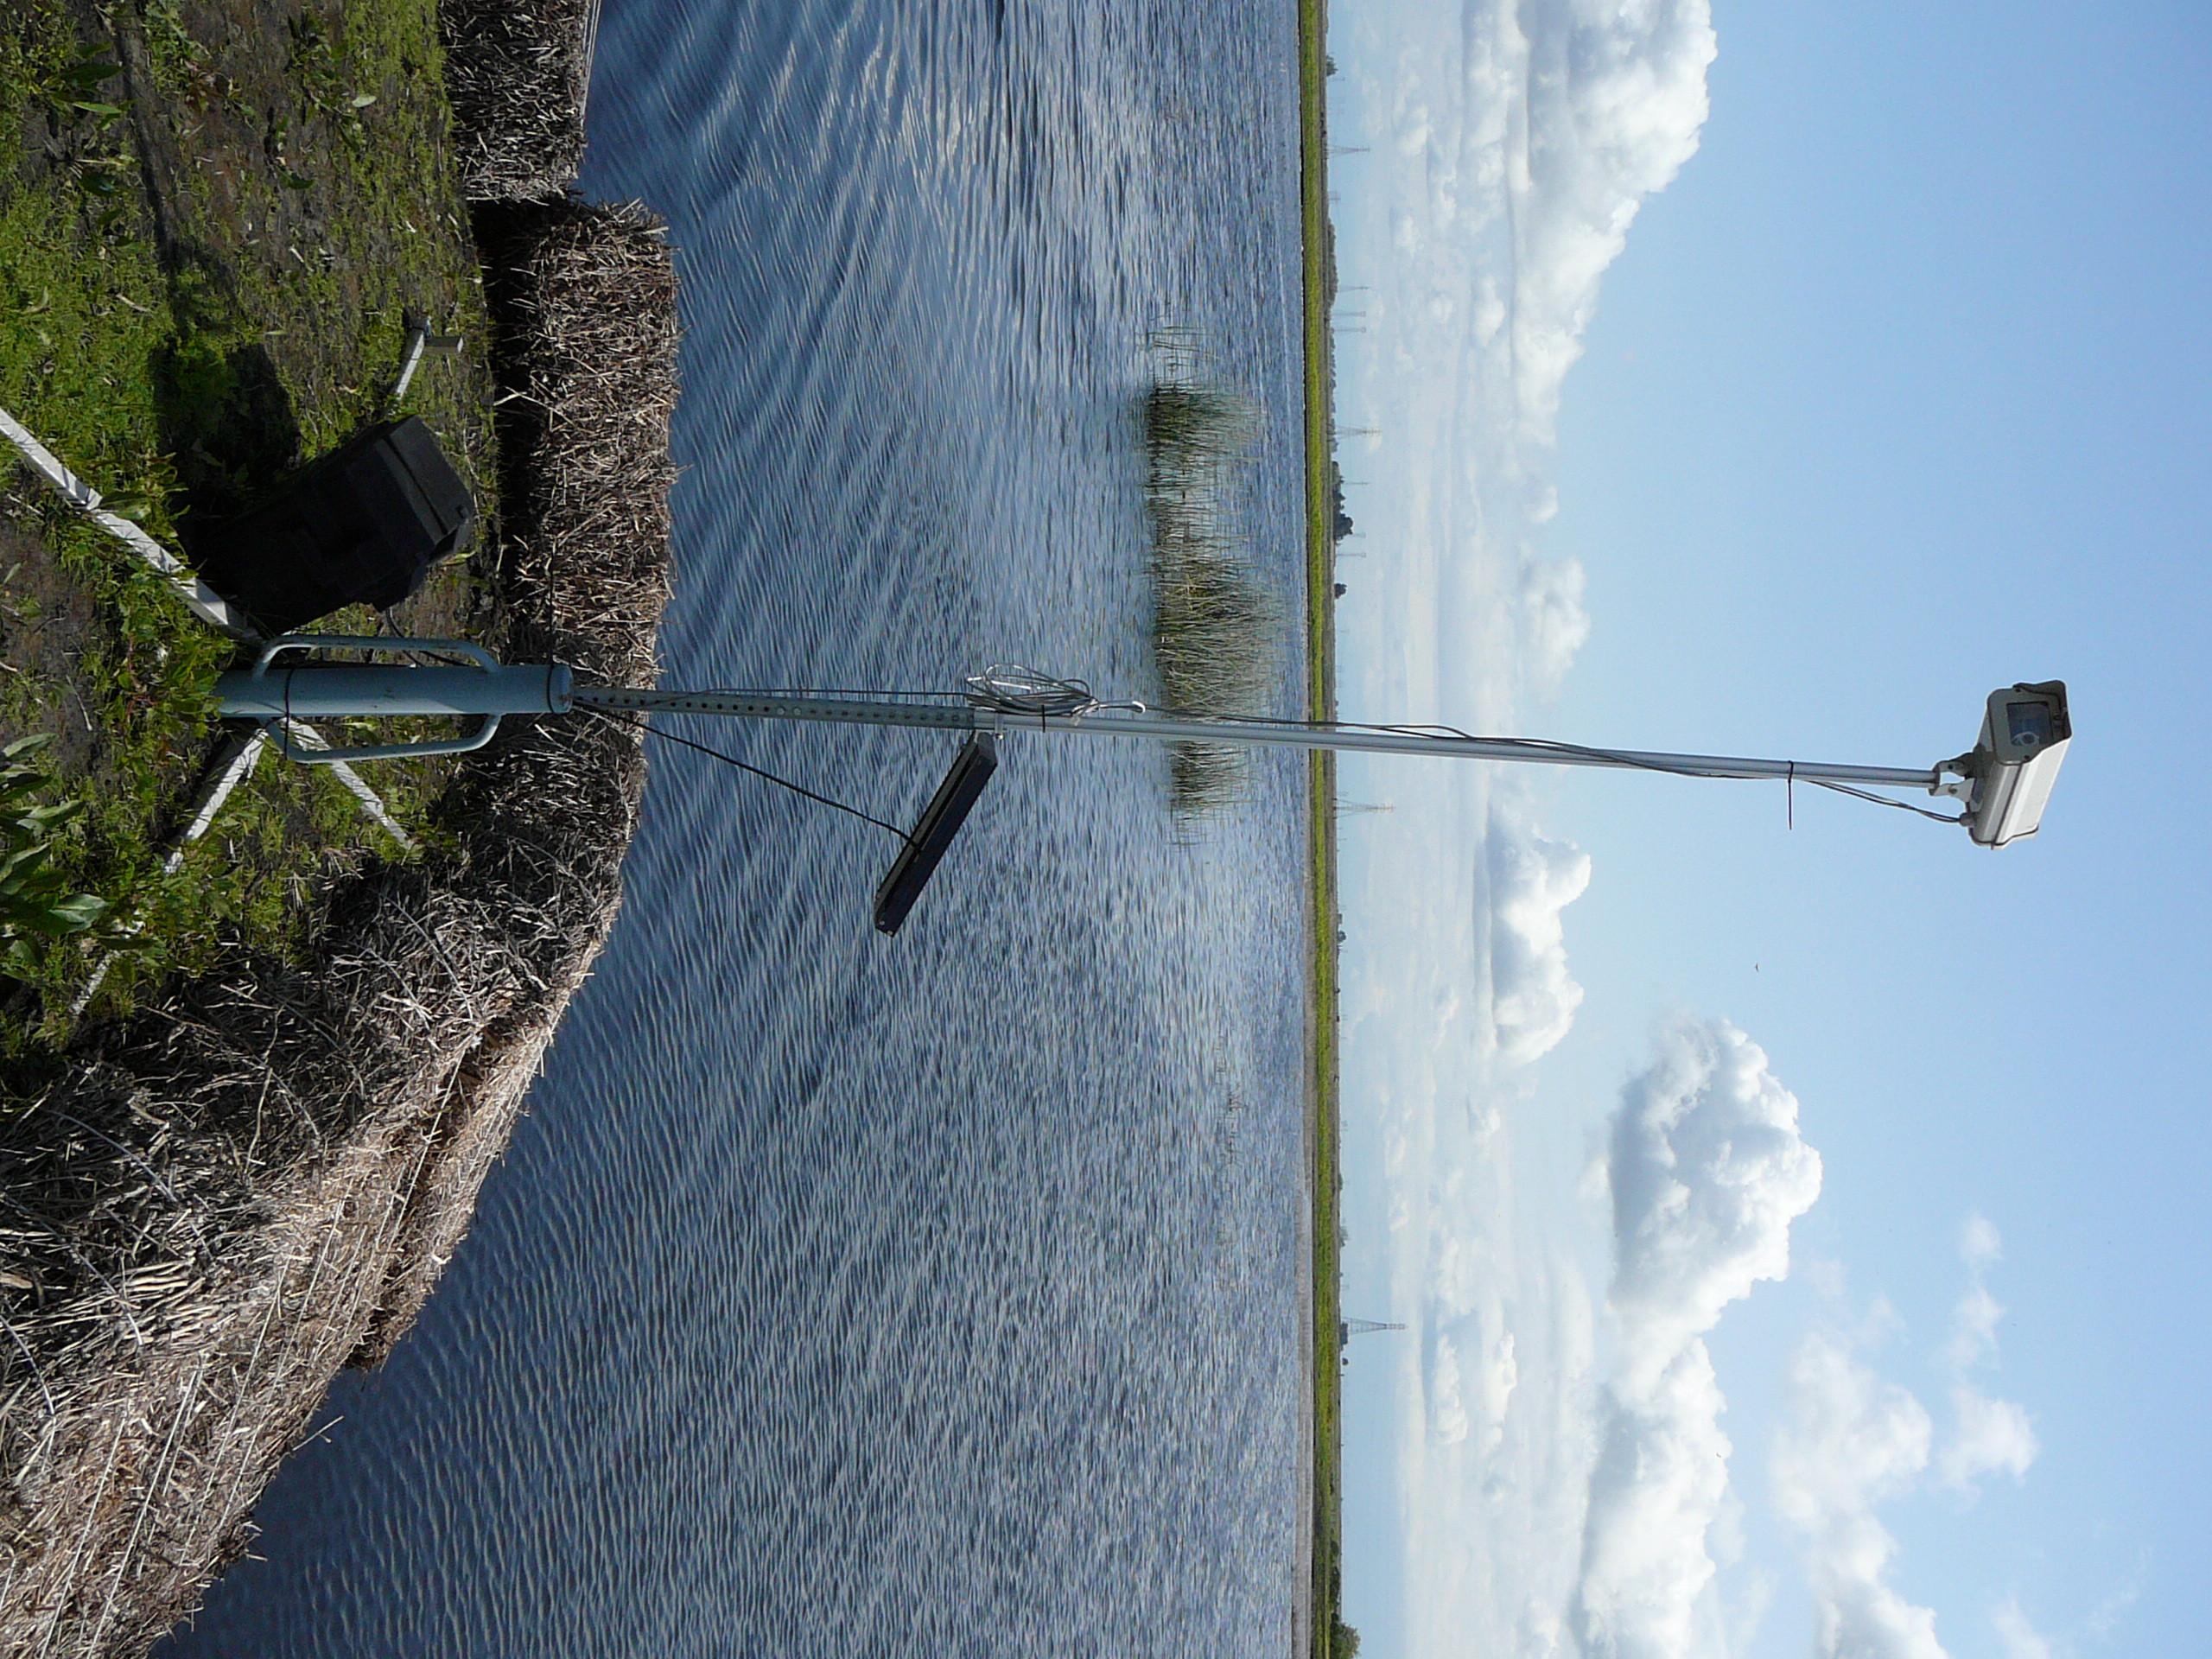
20110413MB_Autocam.jpg ( 2011-04-13 11:08:28 ) Full size: 2560x1920
Autocam

Eggs on pH cable
20110413MB_EggsOnpHCable.jpg ( 2011-04-13 11:33:55 ) Full size: 2560x1920
Eggs on pH cable

Super biofouling on pH sensor
20110413MB_FouledpHSensor.jpg ( 2011-04-13 11:28:16 ) Full size: 2560x1920
Super biofouling on pH sensor

Gavin and Jaclyn servicing the tule tower
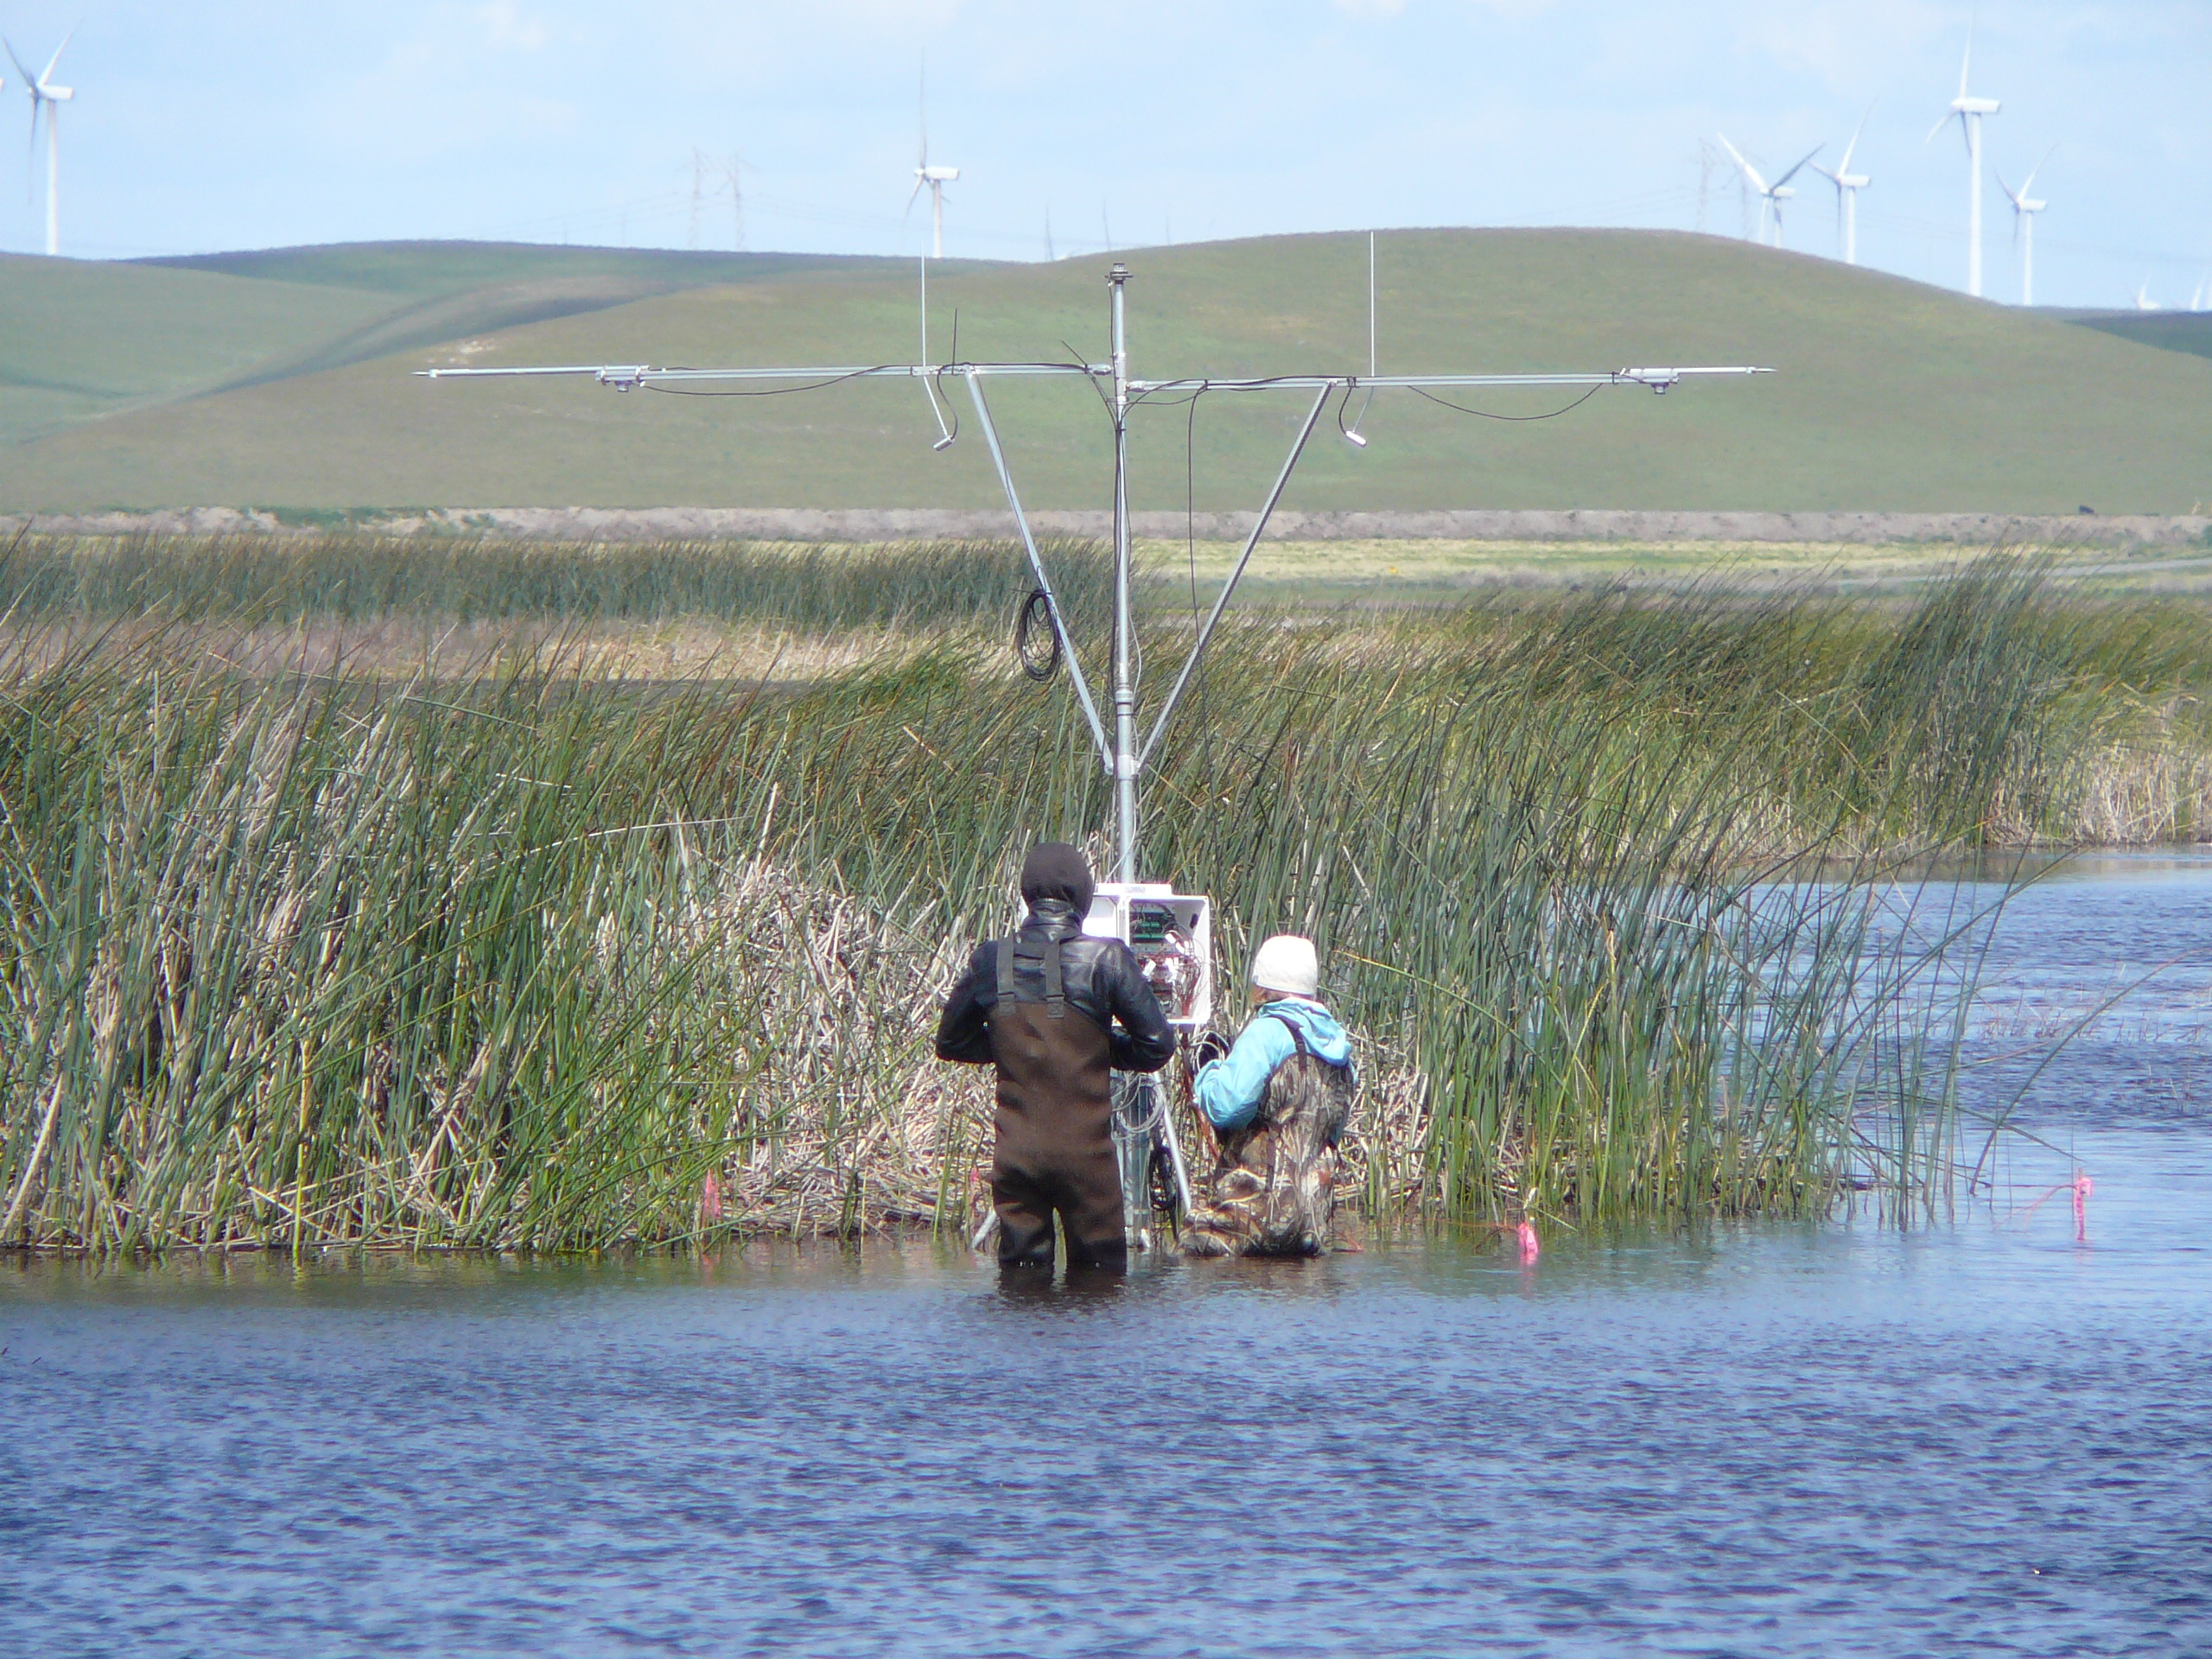
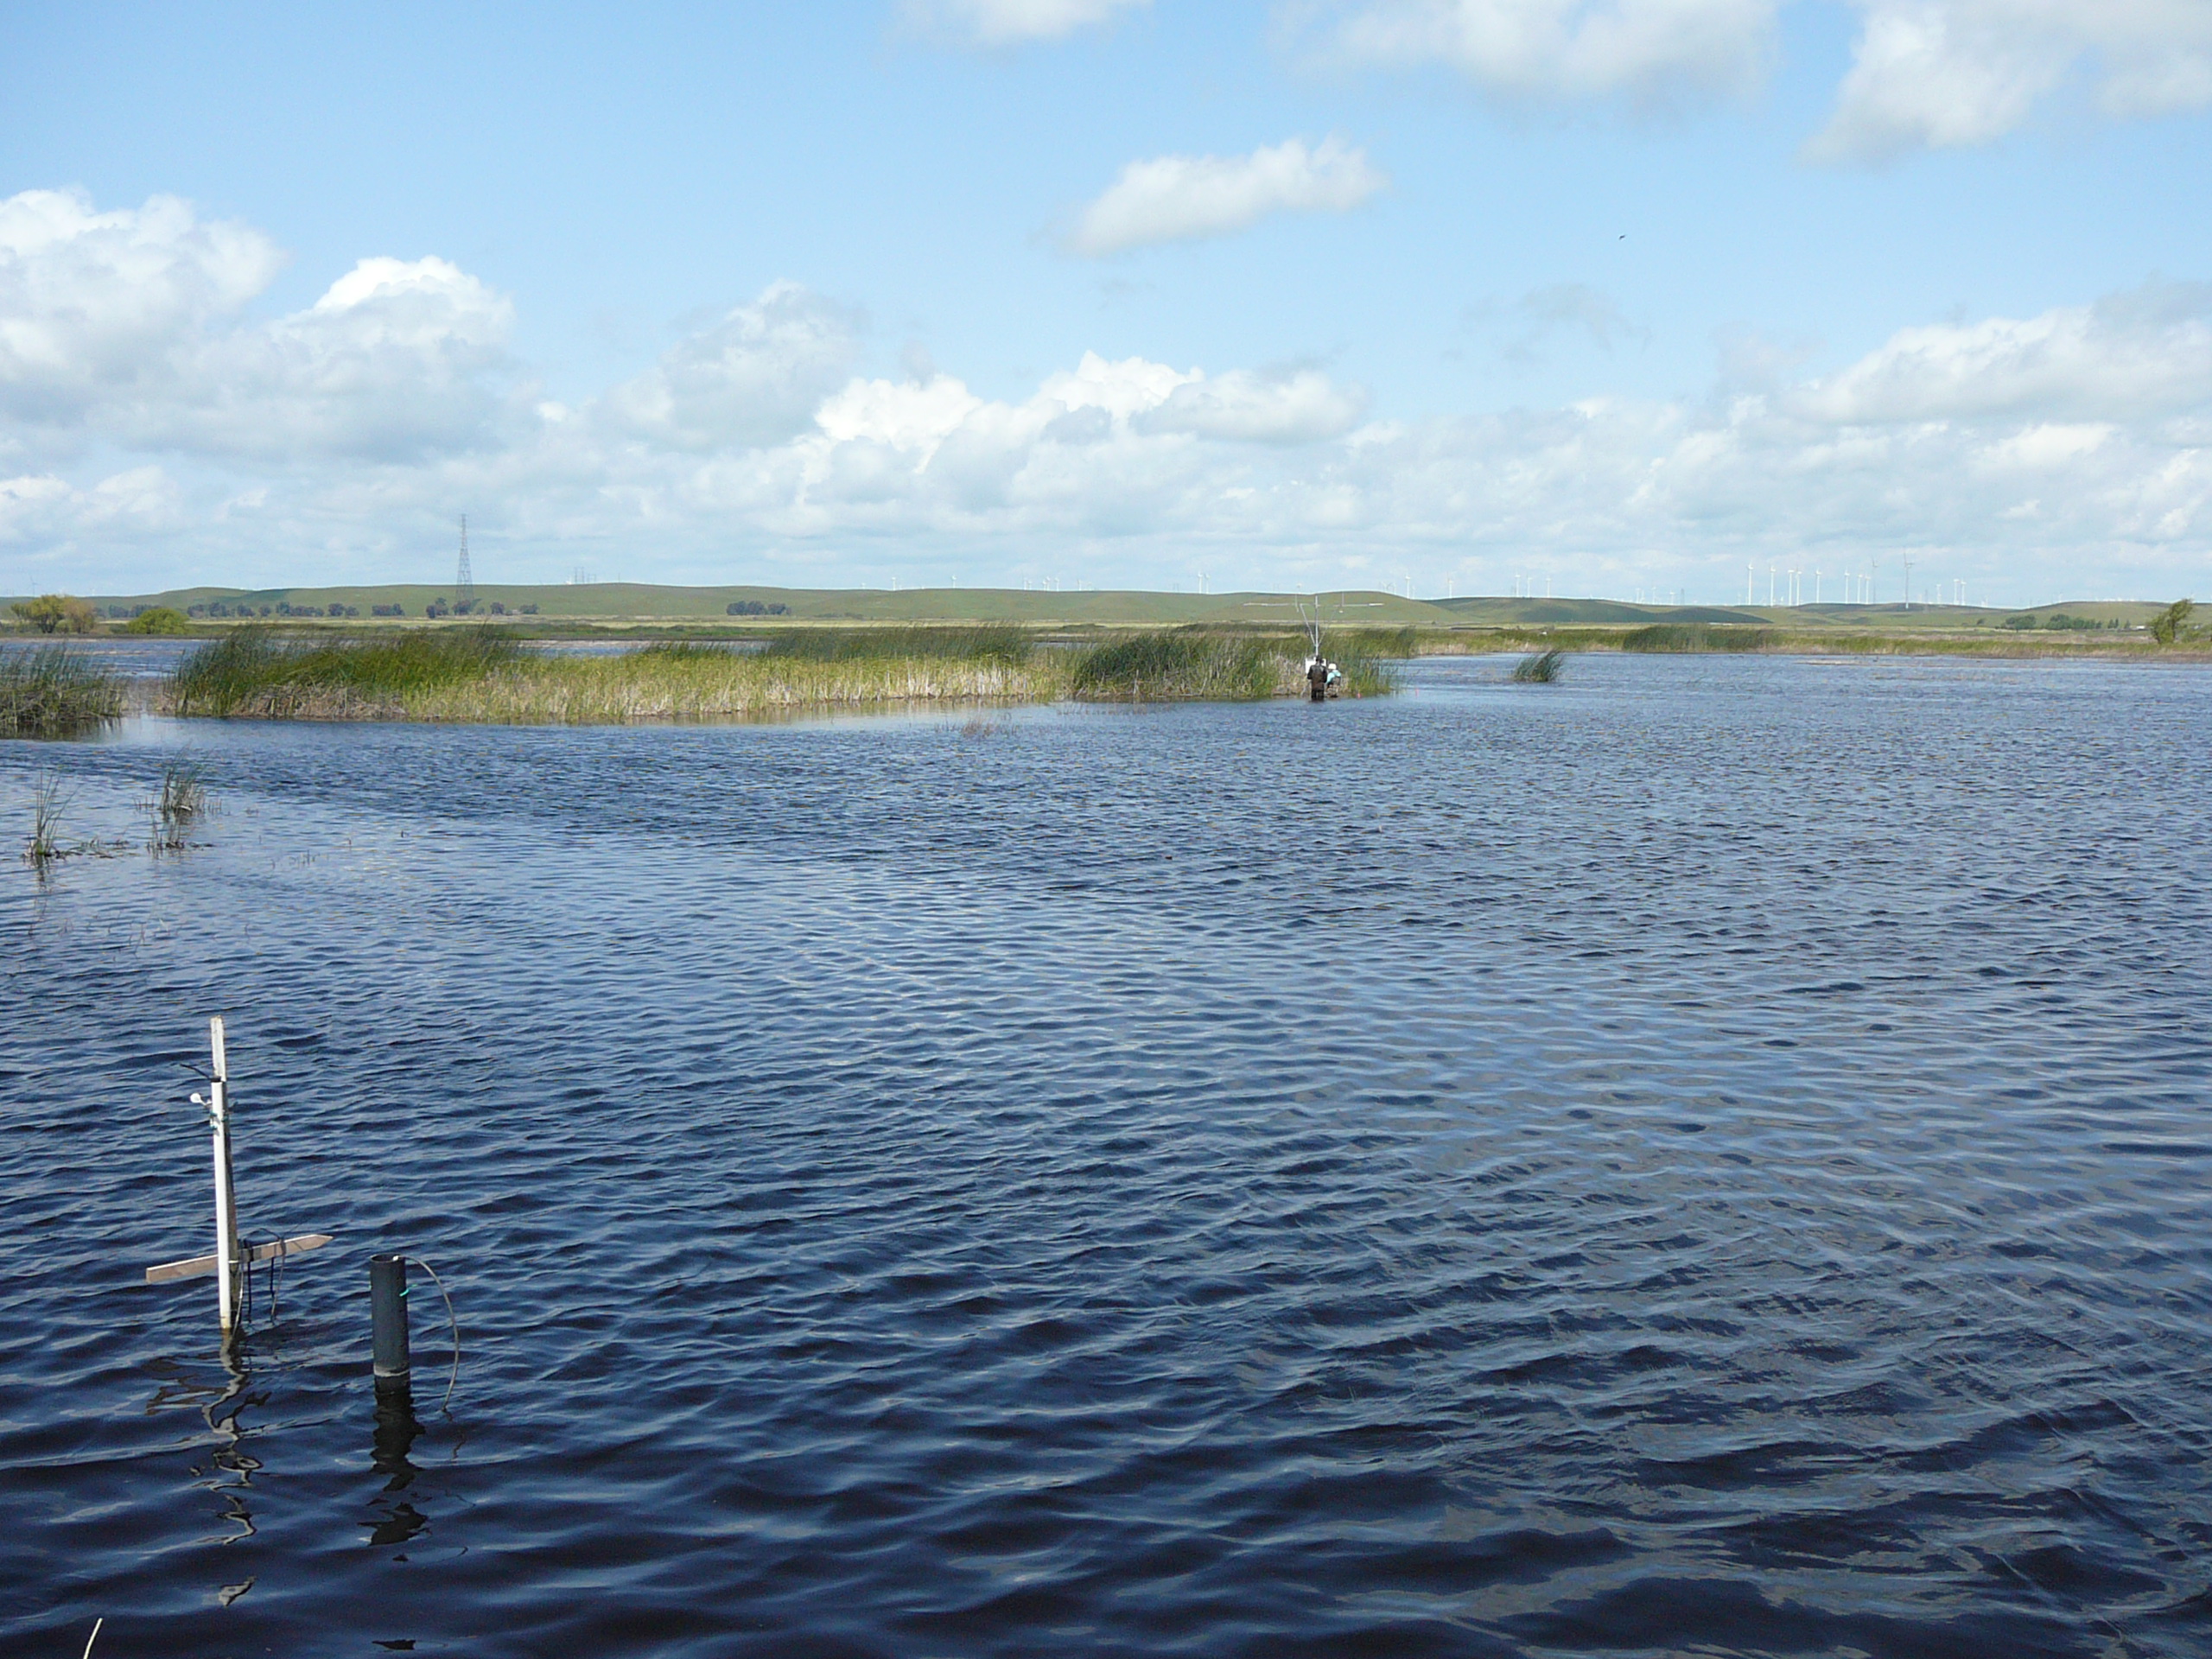
20110413MB_GavinJaclynTule.jpg ( 2011-04-13 11:08:01 ) Full size: 2560x1920
Gavin and Jaclyn servicing the tule tower

Gavin and Jaclyn servicing the tule tower
20110413MB_TuleTower.jpg ( 2011-04-13 11:08:13 ) Full size: 2560x1920
Gavin and Jaclyn servicing the tule tower

Graphs display:
11 sets found

7 MB_flux graphs found

Explore the graph:Sonic Wind in a new window

Explore the graph:LI7700 mV signals in a new window

Explore the graph:Counts in a new window

Explore the graph:LI7700 CH4 from analog signal in a new window

Explore the graph:LI7500 CO2 and H2O in a new window

Explore the graph:LI7700 CH4 from digital signal in a new window

Explore the graph:CO2 in ppm in a new window

5 MB_met graphs found

Explore the graph:MB_met Battery Volts & Panel T in a new window

Explore the graph:Mayberry Soil T in a new window

Explore the graph:Mayberry Water Temperature in a new window

Explore the graph:Mayberry Dissolved Oxygen in a new window

Explore the graph:Mayberry Water Depth in a new window

28 MB_tule graphs found

Explore the graph:MB Tule Tower: Open Water 2 (3/1/11-3/23/17) in a new window

Explore the graph:MB Tule Tower: Open Water 1 (3/1/11-2/21/13) in a new window

Explore the graph:MB Tule Tower: Tule Temps 2 & 3 (3/1/11-3/19/14) in a new window

Explore the graph:MB Tule Tower: Tule Temps 1 (3/1/11-3/19/14) in a new window

Explore the graph:Mayberry Tule Tower: Solar Radiation in a new window

Explore the graph:Mayberry Tule Tower: Disolved Oxygen in a new window

Explore the graph:Mayberry Tule Tower: IRT and Sensor Temp in a new window

Explore the graph:Mayberry Tule Tower: Volts and RH in a new window

Explore the graph:LED NDVI Sensor in a new window

Explore the graph:Water CO2 in a new window

Explore the graph:Water Pressure in a new window

Explore the graph:Fluorometer Data in a new window

Explore the graph:Mayberry pCO2 Profile in a new window

Explore the graph:Water Temperatures in a new window

Explore the graph:Air Temperatures in a new window

Explore the graph:Air Pressure in a new window

Explore the graph:4-Way Radiometer in a new window

Explore the graph:MB Tule Tower: Open Water 1 (2/21/13-3/19/14) in a new window

Explore the graph:MB Tule Tower: Tule Temps 1 (3/19/14-now) in a new window

Explore the graph:MB Tule Tower: Open Water 1 (3/19/14-now) in a new window

Explore the graph:MB Tule Tower: Tule Temps 2 & 3 (3/19/14-3/23/17) in a new window

Explore the graph:MB Tule Tower: Tule Temps 2 (3/23/17-now) in a new window

Explore the graph:MB Tule Tower: Tule Temps 3 (3/23/17-now) in a new window

Explore the graph:SRS NDVI Channels in a new window

Explore the graph:SRS NDVI in a new window

Explore the graph:Net Radiation in a new window

Explore the graph:Conductivity in a new window

Explore the graph:Soil electrical conductivity in a new window

Can't check MBWPEESWGT_mixed
No data found for MB_cam.
Can't check MBEEWPSWEPGT_cam
Can't check SIMBTWEE_met
No data found for MB_minidot.
Can't check MBSWEEWPBCBA
1 MB_processed graphs found

Explore the graph:Mayberry processed CO2 Fluxes in a new window

Can't check MB_fd
1 MB_fd graphs found

Explore the graph:Water Forced Diffusion CO2 Flux in a new window