
Field Notes
<--2024-05-16 08:15:00 | 2024-06-03 16:00:00-->Other sites visited today: Vaira | Tonzi | Bouldin Corn | Bouldin Alfalfa
Phenocam link: Searching...
Hill Slough: 2024-05-22 14:05:00 (DOY 143)
Author: Daphne Szutu
Others: Arman
Summary: Shadowband missing--replaced, CTD conductivity not saved to CR1000--downloaded from CR23X and needs more work, high tide, ducklings
| 2024-05-22 Hill Slough Arman and I arrived at 14:05 PST (15:05 PDT). It was sunny and breezy and near high tide. The staff gauge read 5.2ft at 14:27 PST. We scared away two groups of a dozen ducklings while we walked out along the boardwalk. I downloaded met, cam, and USB GHG data. I installed a shadowband on the dfPAR enclosure to replace the one that got carried away by the wind. I updated the eddy clock +1:10min from 14:22 to 14:23:10 PST to match the laptop time and restarted logging. Arman topped off the wash reservoir and cleaned flux and rad sensors. We measured the surface and porewater conductivities. The 7500 read: 413ppm CO2, 640 mmol/m3 H2O, 25.3C, 101.3kPa, 97SS -- 98 after cleaning The 7700 read: 1.97ppm CH4, 40RSSI – 90 after cleaning Sample, Temperature-compensated conductivity, Temperature Surface, 2342uS, 31.6C Porewater, 5.03mS, 23.2C At the channel, I downloaded the miniDOT data and swapped its desiccant. The sonic rangefinder that we installed last visit had reasonable data. The conductivity value from the CTD is getting saved on the CR23X but not on the CR1000. I double-checked the CR23X and CR1000 programs but couldn’t find anything wrong—the right number of columns should be getting sent to the CR1000. I downloaded the CR23X data so I can fill the CTD conductivity data manually in the CR1000 file before I upload it to the database. We left at 14:45 PST (15:45 PDT). |
1 photos found
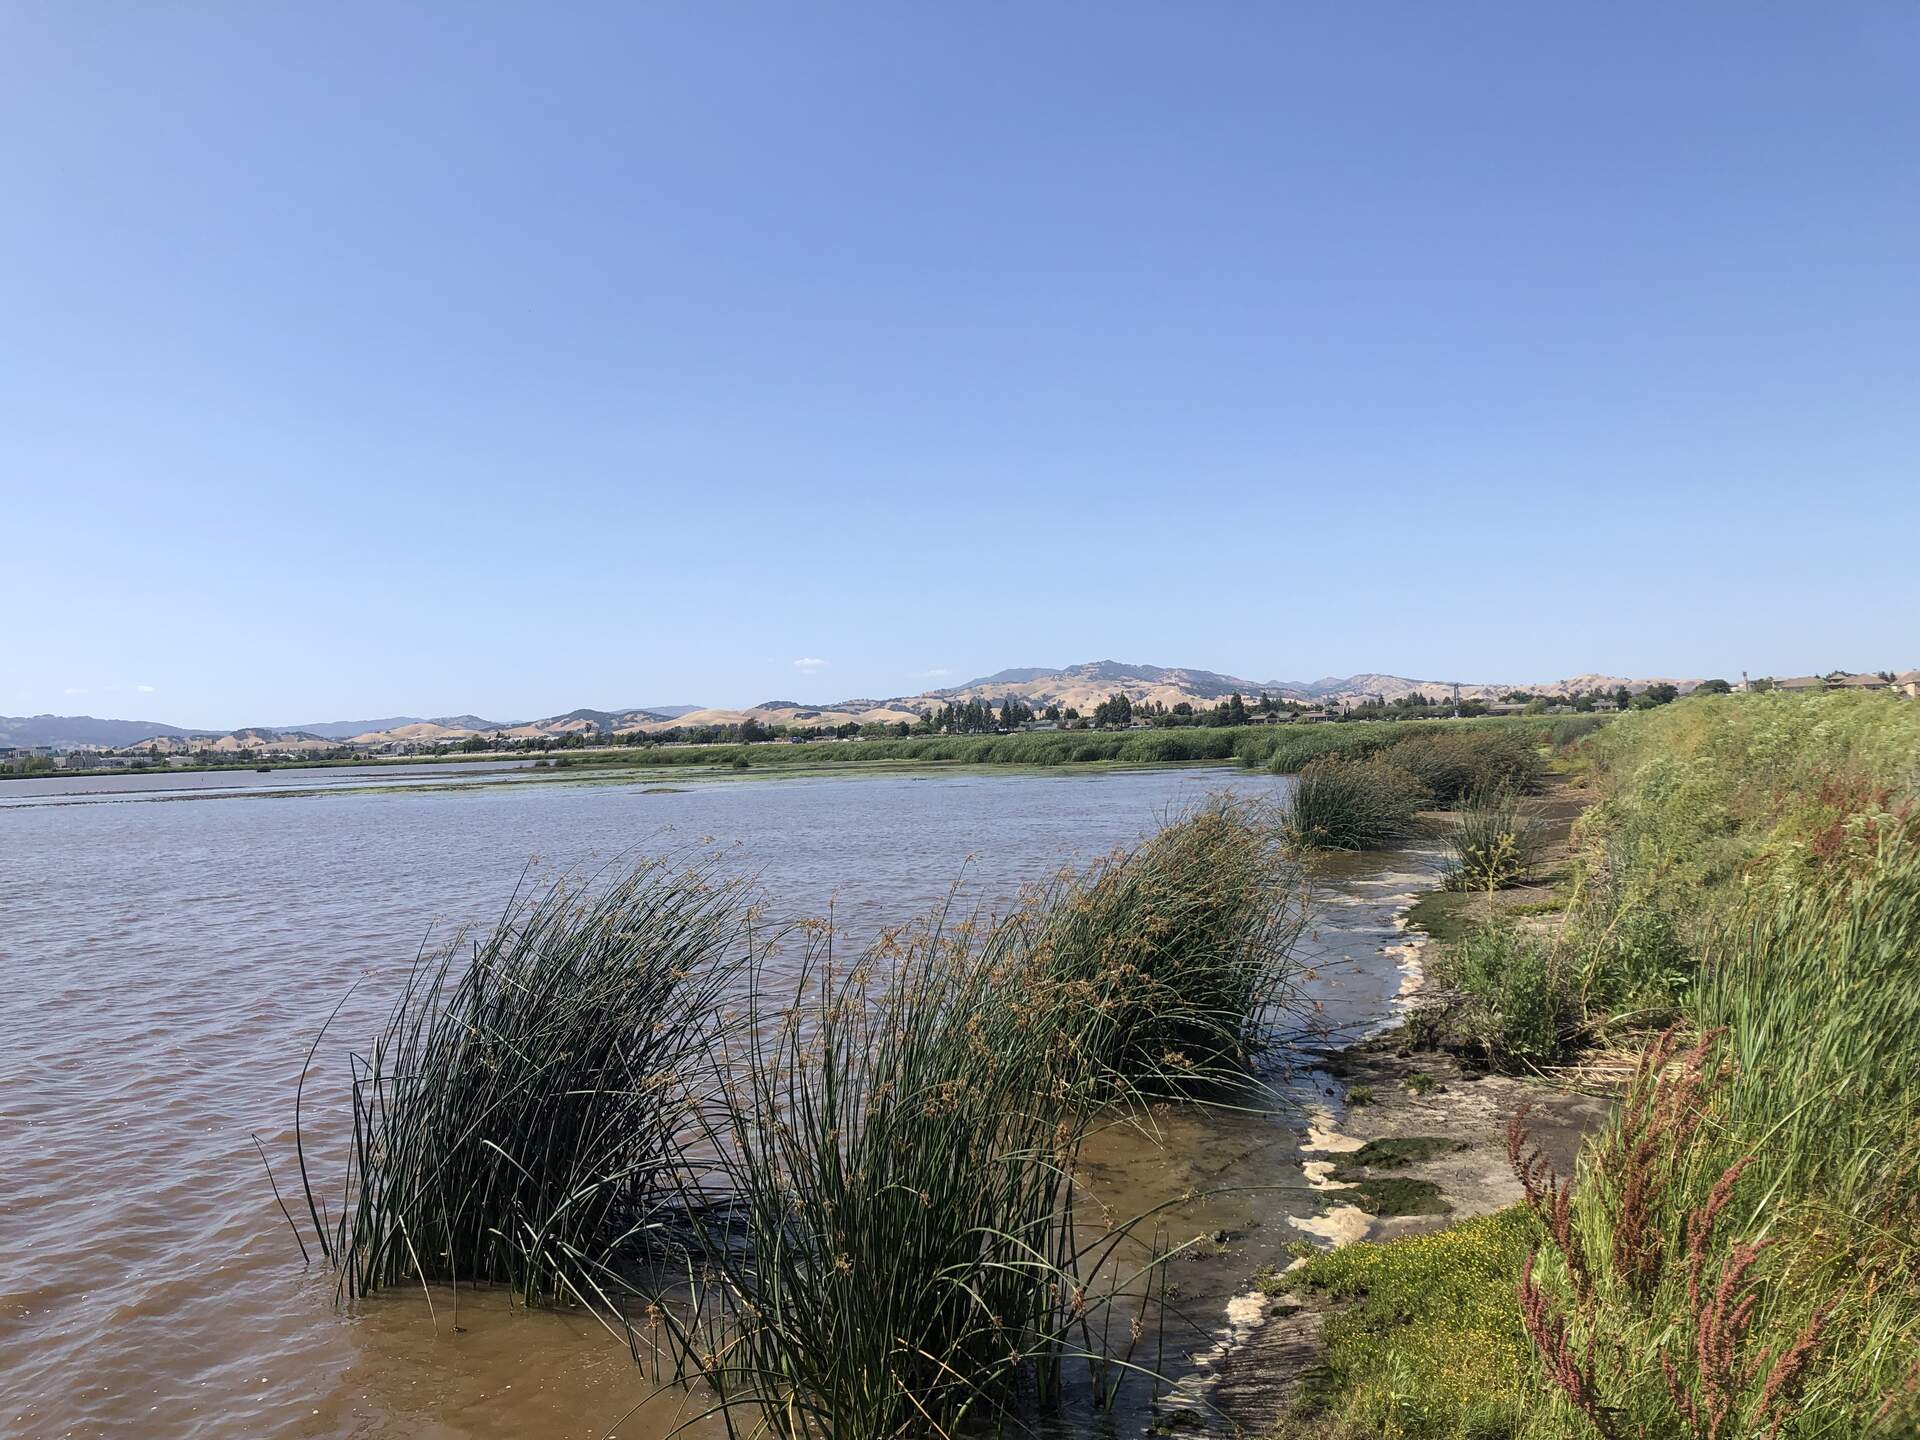
20240522HS_Tules.jpg ( 2024-05-22 15:50:44 ) Full size: 1920x1440
Eastern edge of the wetland is colonizing with tules
4 sets found
20 HS_met graphs found
4 HS_flux graphs found
1 HS_cam graphs found
Can't check HS_Processed
2 HS_Processed graphs found