Field Notes
<--2024-03-26 10:13:00 | 2024-04-22 11:06:00-->Other sites visited today: Hill Slough | Tonzi
Phenocam link: Searching...
Vaira: 2024-04-10 11:20:00 (DOY 101)
Author: Joe Verfaillie
Others:
Summary: Standard fieldwork, new cable for north FD, Jaz battery dead, lots of cows, trees still putting on leaves
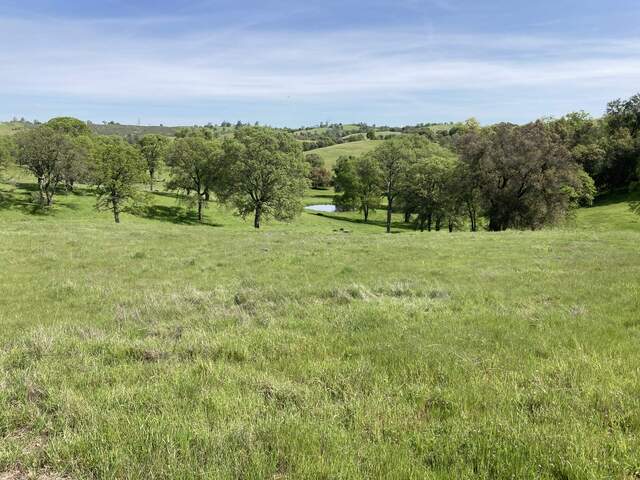
| Vaira 2024-04-10 I arrived at 11:20 PDT. It was warm and sunny with a very light breeze and high thin clouds. The grass is seeding but there is more rain coming this weekend. Lots of happy cows around reclining in the shady grass under the trees. The trees have leaves but still not quite a full canopy I think. There are still puddles on the road. I measured the well and then installed a new longer cable to the north FD chamber. The cable now connects inside the eddy box. I removed the old soil CO2 box and power connection inside the solar controller box. I collected data with the new cable. I collected the met, flux, and camera data. The 7500 read: 425.2ppm CO2, 523.5mmol/m3 H2O, 23.9C, 100.1kPa, 103.1SS I cleaned the Phenocam window inside and out – might be a small shift in FOV. I tried to do spectral measurements but the Jaz battery was dead – it couldn’t complete the boot. I measured veg height but it is pretty patchy 10-30cm with some flowers higher. I left at 12:20 PDT |
Field Data
No tank data
Well Depth
| Date | Location | Depth (feet) |
|---|---|---|
| 2024-04-10 | HS | 3.88 |
| 2024-04-10 | VR_well | 52.55 |
| 2024-04-10 | TZ_floor | 19.7 |
| 2024-04-10 | TZ_road | 28.53 |
| 2024-04-10 | TZ_tower | 23.05 |
| 2024-04-10 | VR_well | 52.55 |
| 2024-04-10 | TZ_floor | 19.7 |
| 2024-04-10 | TZ_road | 28.53 |
| 2024-04-10 | TZ_tower | 23.05 |
No TZ Moisture Point data found
No VR Moisture Point data found
No TZ grass heigth found
Grass Height VR 12
| Date | Height reps (cm) | Location | Average | Samp | STDEV | |||||||||||
|---|---|---|---|---|---|---|---|---|---|---|---|---|---|---|---|---|
| 2024-04-10 | 14 | 10 | 13 | 18 | 16 | 9 | 20 | 17 | 21 | 12 | 30 | 10 | GH_ALL | 15.83 | 12 | 5.71 |
No VR Tree DBH found
No water potential data found
No VR Grass Biomass data found
No VR OakLeaves Biomass data found
No VR PineNeedles Biomass data found
1 photos found

20240410VR_SpringHasSprung.jpg ( 2024-04-10 11:20:38 ) Full size: 1920x1440
Spring has Sprung
9 sets found
16 VR_met graphs found
2 VR_flux graphs found
No data found for VR_soilco2.
2 VR_pond graphs found
Can't check TZVR_mixed
3 VR_fd graphs found
4 VR_processed graphs found
4 VR_arable graphs found
6 VR_soilvue graphs found

