
Field Notes
<--2024-03-26 12:35:00 | 2024-04-22 12:00:00-->Other sites visited today: Hill Slough | Vaira
Phenocam link: Searching...
Tonzi: 2024-04-10 12:30:00 (DOY 101)
Author: Joe Verfaillie
Others:
Summary: Cows ate point dendrometers and IRT cables. Lost pt dendro data, replaced Z-cam1 and 3 clock batteries
| Tonzi 2024-04-10 I arrived at about 12:30 PDT. It was a sunny warm day with some high thin clouds. The trees have leaves but still seems only about 60% of a full canopy. There are still puddles in the road and the big one near the Tower has big tadpoles in it. I climbed the tower and collected the Tower flux, and camera data. I cleaned the radiometers. I collected the Floor flux and well data. The HMP45 fan had a broken ground wire which I fixed. The Tower read: 426.1ppm CO2, 496.1mmol/m3 H2O, 21.7C, 99.4kPa, 104.5SS The Floor read: 422.0ppm CO2, 616.1mmol/m3 H2O, 24.8C, 99.5kPa, 102.6SS I did the moisture point, wells and read the dendrometers. We lost the last couple months of point dendrometer data from the original five HISE systems. We changed the clocks and moved the data files off the uSD cards hoping to begin new files at the end of February. This time when I went to get the data none of the cards had data files. I talked to each unit with the serial connection and saw a line about initializing the sd card. All the units wrote a data line when I left the config menu and I saw one unit write a data line on the hour. So, I think they are all collecting data again. I do have data from five TOMST point dendrometers (three on oaks) for the period missed by the HISE units. I'll try collecting them all again in two weeks and see if things can be filled by inter-comparison. Additionally, cows ate two of the HISE units. One sn 4083-1 they pulled the solar power cable and the power connector came off the circuit board. I think I was able to re-solder it in the field. The other I had to bring in sn 4084-1 and sn DS-101 - should be repairable. I also find that the HISE mounts for the sensors get loose and the sensors move - maybe the cause of some of the jumps in the data. I'll try adding locking nuts to the mounts. The cows also ate cables on the IRT tripod. One solar panel cable the radio antenna cable and antenna, and the lower/ground IRT sn 1964 cable. It’s questionable as to whether I should repair this or just remove it. I think it is a slightly interesting, long term data set that shows the difference between canopy and ground surface temperature. I serviced the z-cams. Z-cam 1 and 3 had dead clock batteries. I replaced these and reset their clocks – should be good to go. I tried to do midday water potential. Tree 102 and Liukang’s tree (92) still have baby leaves for the most part. I got one sprig from 102 and two from 92. WP was about 12Bar. I checked on the Sierra Wireless moden/router. Its address is 192.168.2.31:9191 and its login is user/Fiedvar1. Wifi is disabled, but I might set it up for Troy if there wifi keeps giving them trouble. I left at about 16:50 PDT |
Field Data
No tank data
Well Depth
| Date | Location | Depth (feet) |
|---|---|---|
| 2024-04-10 | HS | 3.88 |
| 2024-04-10 | VR_well | 52.55 |
| 2024-04-10 | TZ_floor | 19.7 |
| 2024-04-10 | TZ_road | 28.53 |
| 2024-04-10 | TZ_tower | 23.05 |
| 2024-04-10 | VR_well | 52.55 |
| 2024-04-10 | TZ_floor | 19.7 |
| 2024-04-10 | TZ_road | 28.53 |
| 2024-04-10 | TZ_tower | 23.05 |
No TZ Moisture Point data found
No VR Moisture Point data found
No TZ grass heigth found
Grass Height VR 12
| Date | Height reps (cm) | Location | Average | Samp | STDEV | |||||||||||
|---|---|---|---|---|---|---|---|---|---|---|---|---|---|---|---|---|
| 2024-04-10 | 14 | 10 | 13 | 18 | 16 | 9 | 20 | 17 | 21 | 12 | 30 | 10 | GH_ALL | 15.83 | 12 | 5.71 |
Tree DBH
| Date | Tag# | Reading (mm) |
|---|---|---|
| 2024-04-10 | 1 | 22.8 |
| 2024-04-10 | 1 | 22.8 |
| 2024-04-10 | 2 | 16.4 |
| 2024-04-10 | 2 | 16.4 |
| 2024-04-10 | 245 | 10.6 |
| 2024-04-10 | 245 | 10.6 |
| 2024-04-10 | 3 | 8.2 |
| 2024-04-10 | 3 | 8.2 |
| 2024-04-10 | 4 | 10.2 |
| 2024-04-10 | 4 | 10.2 |
| 2024-04-10 | 5 | 19.2 |
| 2024-04-10 | 5 | 19.2 |
| 2024-04-10 | 6 | 8.5 |
| 2024-04-10 | 6 | 8.5 |
| 2024-04-10 | 7 | 16.2 |
| 2024-04-10 | 7 | 16.2 |
| 2024-04-10 | 72 | 7.9 |
| 2024-04-10 | 72 | 7.9 |
| 2024-04-10 | 79 | 7.6 |
| 2024-04-10 | 79 | 7.6 |
Water Potential - mode: raw
| Time | Species | Tree | readings (bar) | |
|---|---|---|---|---|
| 2024-04-10 12:08:00 | OAK | 102 | -10 | |
| 2024-04-10 12:08:00 | OAK | 92 | -11 | -14 |
No TZ Grass Biomass data found
No TZ OakLeaves Biomass data found
No TZ PineNeedles Biomass data found
1 photos found
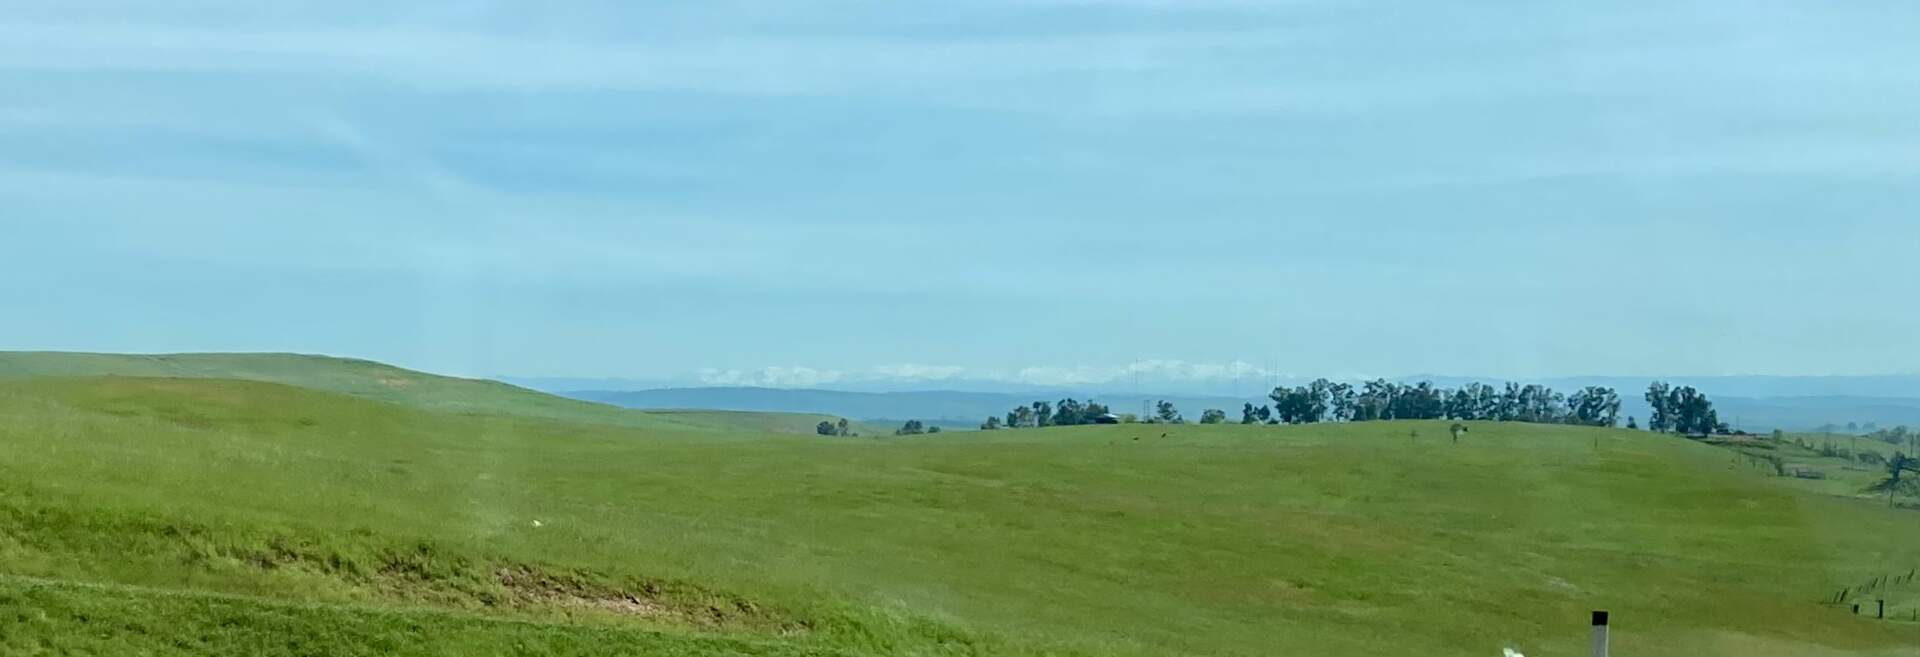
20240410TZ_SierraSnow.jpg ( 2024-04-10 10:48:48 ) Full size: 1920x657
Snow in the Sierras
16 sets found
No data found for TZ_Fenergy.
11 TZ_tmet graphs found
No data found for TZ_soilco2.
Can't check TZ_mixed
3 TZ_mixed graphs found
1 TZ_fflux graphs found
8 TZ_fmet graphs found
No data found for TZ_tram.
3 TZ_co2prof graphs found
1 TZ_irt graphs found
No data found for TZ_windprof.
1 TZ_tflux graphs found
8 TZ_sm graphs found
Can't check TZ_met
1 TZ_met graphs found
Can't check TZVR_mixed
8 TZ_osu graphs found
3 TZ_fd graphs found
Tonzi Z-cam data