
Field Notes
<--2024-03-07 12:30:00 | 2024-04-10 11:20:00-->Other sites visited today: Tonzi
Phenocam link: Searching...
Vaira: 2024-03-26 10:13:00 (DOY 86)
Author: Joe Verfaillie
Others:
Summary: Swapped 7500 for calibration, added repaired FD chamber to north location, removed old HMP45, standard fieldwork.
| Vaira 2024-03-26 I arrived at about 10:13 PDT. It was a very pretty day if a little cool. The trees have started to put on leaves. It was mostly sunny with fluffy white clouds, a cool breeze from the southwest and a scattering of wild flowers. There was heavy dew on the grass. The cows left a lot of evidence of their presence including a bare patch where we usually park but I didn’t see any cows. I measured the well. I installed a recently repaired FD chamber sn FD20160001 in the north location. I brought a longer cable but it was a couple meters short from reaching the eddy box. I decided to wire it into the solar controller box. I had to drill a new hole in the box. I removed the power line to the old soil co2 box. When I plugged the FD chamber in, it had power but I was unable to connect by serial. I tested a few things and decide the long cable was bad. I put the old stuff back together and made a connection to the chamber. I set its clock and set its sampling rate to 5min. Hopefully I can find a working longer cable to fix it next time. I collected the met, flux, camera and FD data. The Phenocam window needs cleaning next time. I swapped the 7500: sn 0035 came off and sn 0042 went on. I updated the pressure coefficients and reset the box. 0035 read: 429.2ppm CO2, 457.7mmol/m3 H2O, 16.1C, 99.9kPa, 99.4SS 0042 read: 425.5ppm CO2, 447.9mmol/m3 H2O, 15.6C, 100.0kPa, 100.5SS I removed the old HMP45 sn W0730037 and solar shield and moved the new HygroVue to the original mounting location. I updated the met program removing the data from the revbow table. The old HMP was the first couple channels on the AM16/32 so I left some code to skip these channels. I pulled a bunch of old stuff out of the eddy box: keyboard, screen, modem and cables. These are pretty dirty with mouse excrement and can probably go directly into e-waste. I put some rocks in the cable hole in the box to hopefully block access to the rodents. I went to the pond and collected the pond data. All seemed well. I left at about 12:25 PDT |
Field Data
No tank data
Well Depth
| Date | Location | Depth (feet) |
|---|---|---|
| 2024-03-26 | VR_well | 53.2 |
| 2024-03-26 | VR_pond | 21.5 |
| 2024-03-26 | TZ_floor | 21.6 |
| 2024-03-26 | TZ_road | 29.95 |
| 2024-03-26 | TZ_tower | 25 |
No TZ Moisture Point data found
No VR Moisture Point data found
No TZ grass heigth found
No VR grass heigth found
No VR Tree DBH found
No water potential data found
No VR Grass Biomass data found
No VR OakLeaves Biomass data found
No VR PineNeedles Biomass data found
1 photos found
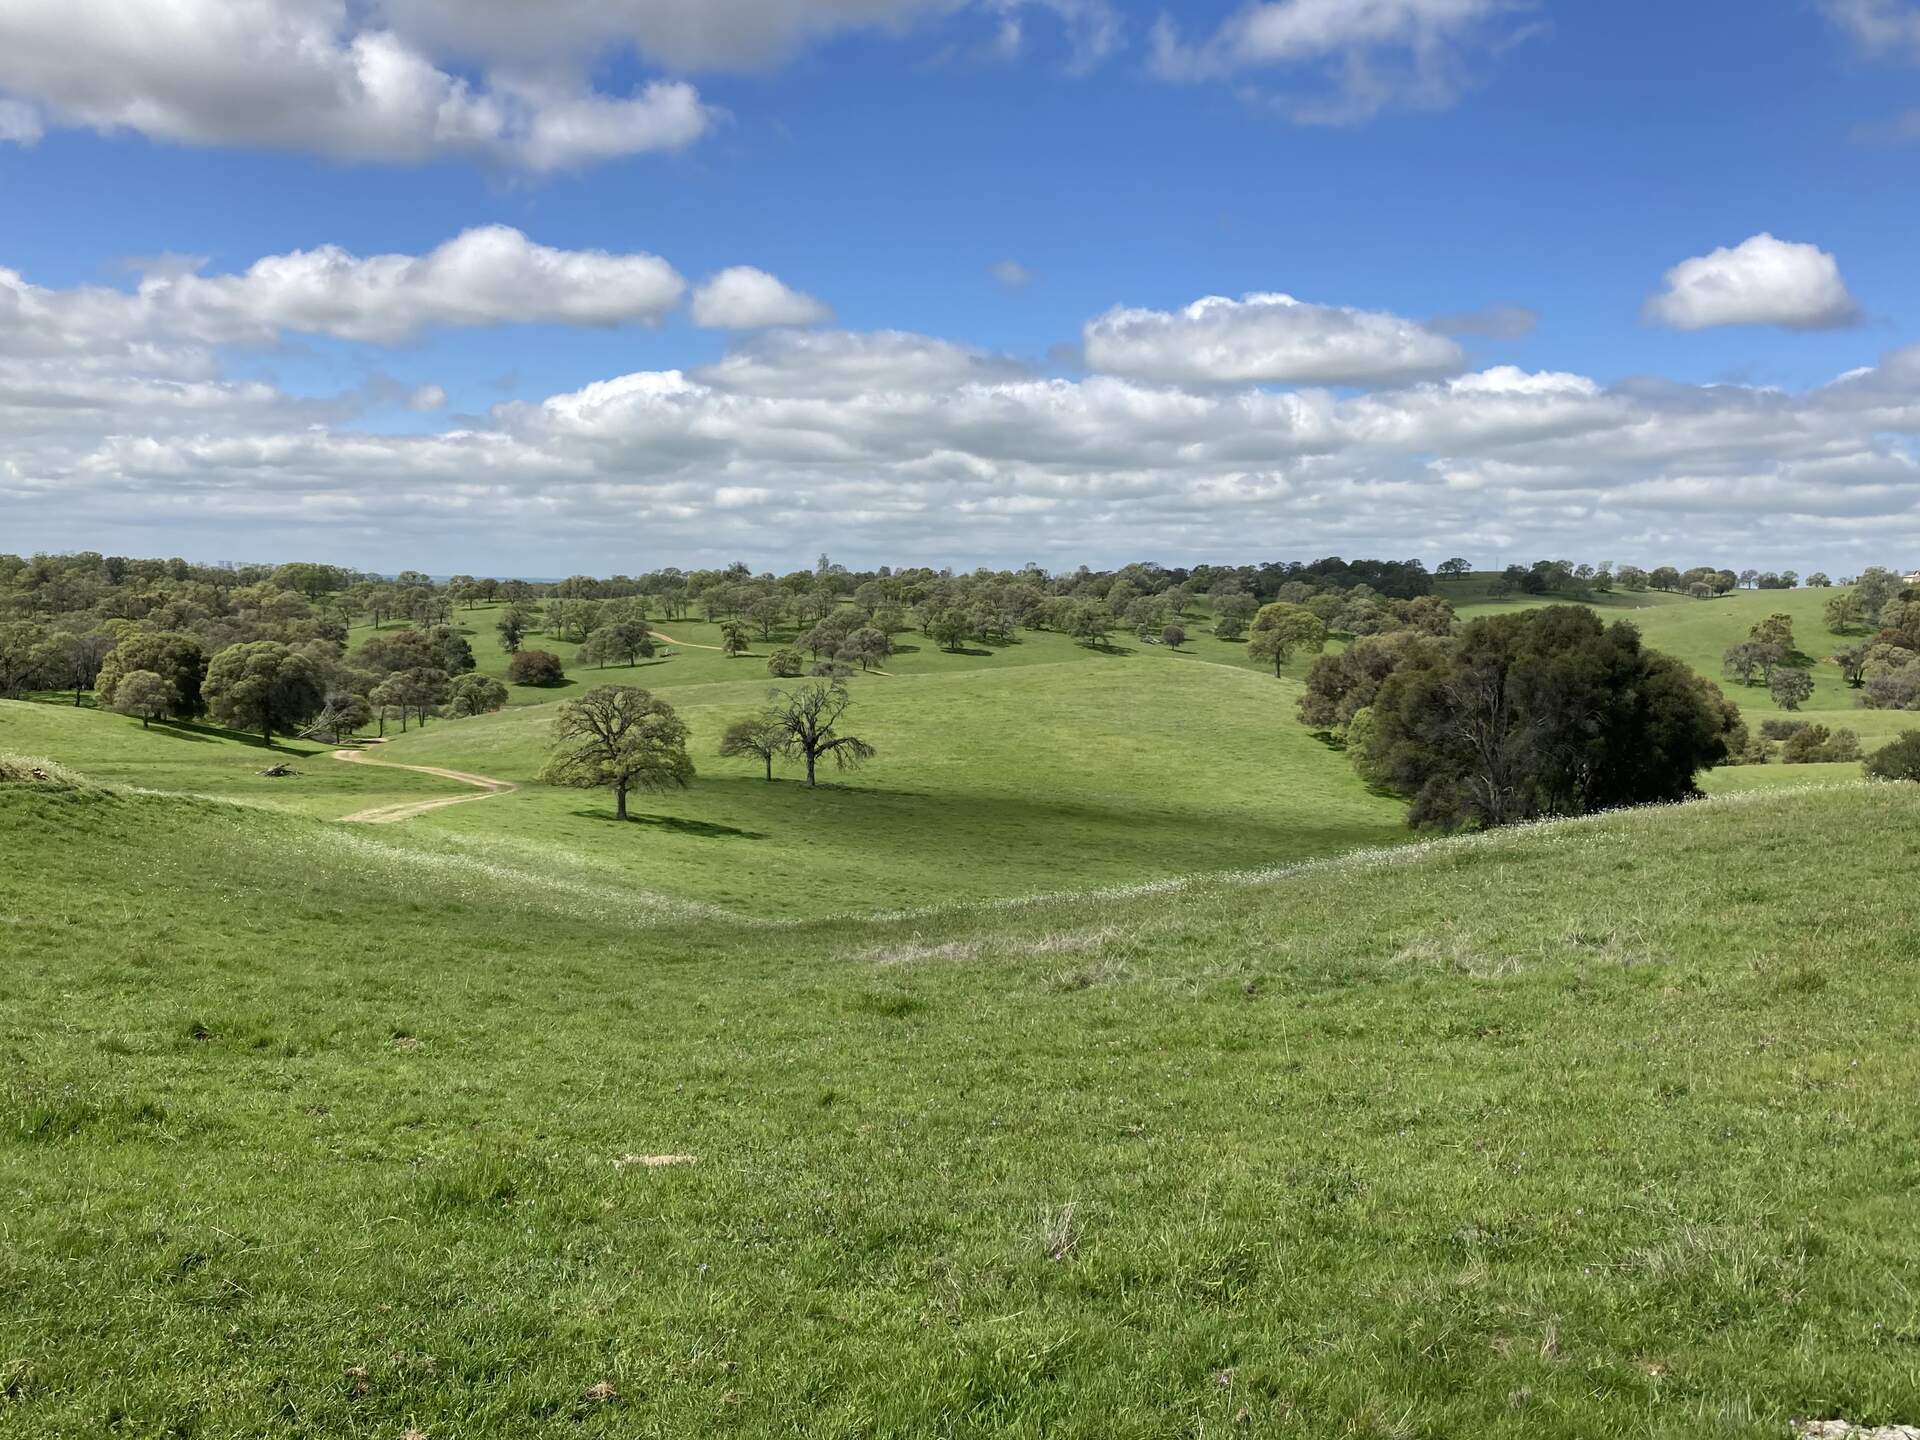
20240326VR_SpringView.jpg ( 2024-03-26 12:18:50 ) Full size: 1920x1440
View to the west from the hill near the pond
9 sets found
16 VR_met graphs found
2 VR_flux graphs found
No data found for VR_soilco2.
2 VR_pond graphs found
Can't check TZVR_mixed
3 VR_fd graphs found
4 VR_processed graphs found
4 VR_arable graphs found
6 VR_soilvue graphs found