Field Notes

<--2023-11-13 11:00:00 | 2023-12-13 11:30:00-->
Other sites visited today: Mayberry | Bouldin Corn | Tonzi

Vaira: 2023-11-30 12:30:00 (DOY 334)
Author: Joe Verfaillie
Others: Daphne

Summary: Standard fieldwork. Dead woodpecker.

Vaira
2023-11-30

Daphne and I arrived at about 12:30 PST. We are a little late today due to a stop in the Delta. It is mostly overcast here and cool. It doesn’t look like much rain has fallen in the last couple weeks. The grasses and herbs are still trying but should be getting too cold soon. The trees still look pretty green.

This was just quick smash and grab. Daphne did the well, spectra and collected data from the north FD chamber on the Delta laptop.

I collected the met, flux, camera and west FD data. All seemed well.
The 7500 read: 433.5ppm CO2, 432.1mmol/m3 H2O, 16.7C, 99.5kPa, 112.0SS

There was a dead woodpecker at the base of the radiation tower. It looked like its beak was broken but otherwise unmolested.

We left at about 13:00 PST.

Field Data

No tank data

Well Depth

DateLocationDepth (feet)
2023-11-30VR_well60.36
2023-11-30TZ_floor28.88
2023-11-30TZ_tower33.62
2023-11-30TZ_road37.5

No TZ Moisture Point data found

No VR Moisture Point data found

No TZ grass heigth found

No VR grass heigth found

No VR Tree DBH found

No water potential data found

No VR Grass Biomass data found

No VR OakLeaves Biomass data found

No VR PineNeedles Biomass data found

1 photos found
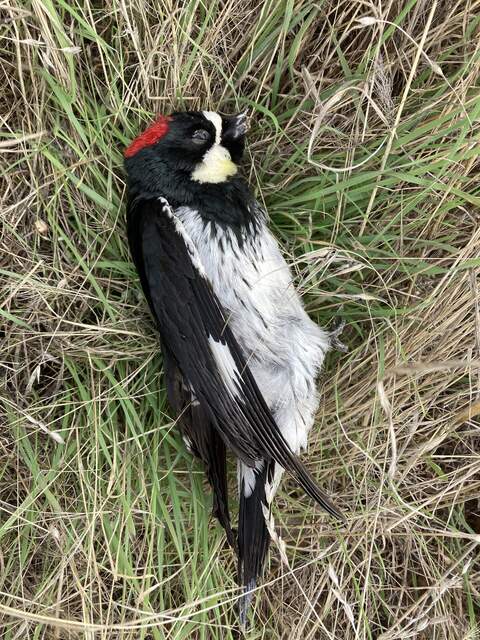
Dead woodpecker at the base of the radiation tower looks to have a broken beak
20231130VR_DeadWoodpecker.jpg ( 2023-11-30 12:51:55 ) Full size: 1440x1920
Dead woodpecker at the base of the radiation tower looks to have a broken beak

Graphs display:
9 sets found

16 VR_met graphs found

Explore the graph:Temperatures in a new window

Explore the graph:System Power Voltage in a new window

Explore the graph:Soil Temperatures Set 1 in a new window

Explore the graph:Soil Temperatures Set 2 in a new window

Explore the graph:Soil Temperature Set 3 in a new window

Explore the graph:Soil Temperature at -4cm in a new window

Explore the graph:Soil Heat Flux in a new window

Explore the graph:Soil Moisture in a new window

Explore the graph:Photosynthetic Active Radiation in a new window

Explore the graph:Short/Long Wave Radiation in a new window

Explore the graph:LED sensor in a new window

Explore the graph:Vaira PPT in a new window

Explore the graph:Peltier SHF Plates in a new window

Explore the graph:Peltier SHF Temperatures in a new window

Explore the graph:LED NDVI in a new window

Explore the graph:NDVI SRS Raw Data in a new window

2 VR_flux graphs found

Explore the graph:CO2 Density in a new window

Explore the graph:Sonic Wind in a new window

No data found for VR_soilco2.
2 VR_pond graphs found

Explore the graph:Pond Level and Rain in a new window

Explore the graph:Vaira Pond Temperatures in a new window

Can't check TZVR_mixed
3 VR_fd graphs found

Explore the graph:Varia Forced Diffusion Soil CO2 Flux in a new window

Explore the graph:Vaira Forced Diffusion CO2 Concentration in a new window

Explore the graph:VR Forced Diffusion Temperature in a new window

4 VR_processed graphs found

Explore the graph:VR VPD in a new window

Explore the graph:NEE in a new window

Explore the graph:Soil Water Content in a new window

Explore the graph:Gap Filled GPP in a new window

4 VR_arable graphs found

Explore the graph:Incoming bands in a new window

Explore the graph:Reflected Bands in a new window

Explore the graph:Solar Radiation in a new window

Explore the graph:Pressure and RH in a new window

6 VR_soilvue graphs found

Explore the graph:VR SoilVUE Profile B VWC in a new window

Explore the graph:VR SoilVue B Temperature in a new window

Explore the graph:VR SoilVue A Temperature in a new window

Explore the graph:VR SoilVue C Temperature in a new window

Explore the graph:VR SoilVUE Profile A VWC in a new window

Explore the graph:VR SoilVUE Profile C VWC in a new window