
Field Notes
<--2023-11-20 16:25:00 | 2023-12-08 08:30:00-->Other sites visited today: Bouldin Corn | Vaira | Tonzi
Phenocam link: Searching...
Mayberry: 2023-11-30 09:45:00 (DOY 334)
Author: Daphne Szutu
Others: Joe
Summary: Installed collars for Kuno's soil campaign next week, SWout funky--fixed maybe, tested waders, lots of cattail fluff
| 2023-11-30 Mayberry Joe and I arrived at 9:45 PST on our way to Tonzi/Vaira. We are preparing for Kuno’s wetland flux campaign next week by installing some soil collars ahead of time to let them settle. It was sunny with a cold breeze and a few scattered clouds near the horizon. Lots of cattail fluff streaming through the air, which is very pretty but gets everywhere. Joe cleaned the staff gauge, which read 19.5cm. Still no continuous water level sensor here, although the sonic rangefinder might be an ok proxy. A new HYDROS21 was shipped this week so hopefully I can install it next week. Joe tested the waterproof-ness of the size 13 waders. I’ve tried to repair the leaks this past week with Seal-All, but today the waders leaked at the top of the boots immediately, so it’s more than a simple fix. We’ll buy a new size 13 pair for next week and discard the old ones. To install the collars, we walked along the western edge of the channel, traveling northwest from the tower. We installed 6 soil collars, 5 in mucky soil along the channel edge among the vegetation, and 1 in dry soil in the wetland interior next to a downed patch of cattails. Each collar was about 20m (or 25 steps) apart. Back at the tower, I cleaned the picam window because the photos from the last batch were smudged with bird poop. SWout has also been weirdly low with negative numbers (around -2mV when we arrived). I checked the wiring, which seemed ok. I redid the wires anyways and unplugged/replugged the mux block. After fussing with it, the SWout reading seemed better, 0.88mV. I downloaded the met and flux data only and I’ll check the SWout again next time. I thought the HMP fan was dead but actually, it was just full of wasps. Joe chased the wasps away and reassembled the radiation shield. I cleaned spiderwebs and cattail fluff from the flux analyzers. The radiometers looked ok so I didn’t clean them. The reservoir was 90% full; I did not refill. The reservoir box was full of sleepy wasps, so I left the lid open. The 7500 read: 432ppm CO2, 403 mmol/m3 H2O, 18.3C, 101.0kPa, 105SS after cleaning The 7700 read: 2.05ppm CH4, 58RSSI after cleaning We left at 11:05 PST to continue on to Tonzi/Vaira. |
2 photos found
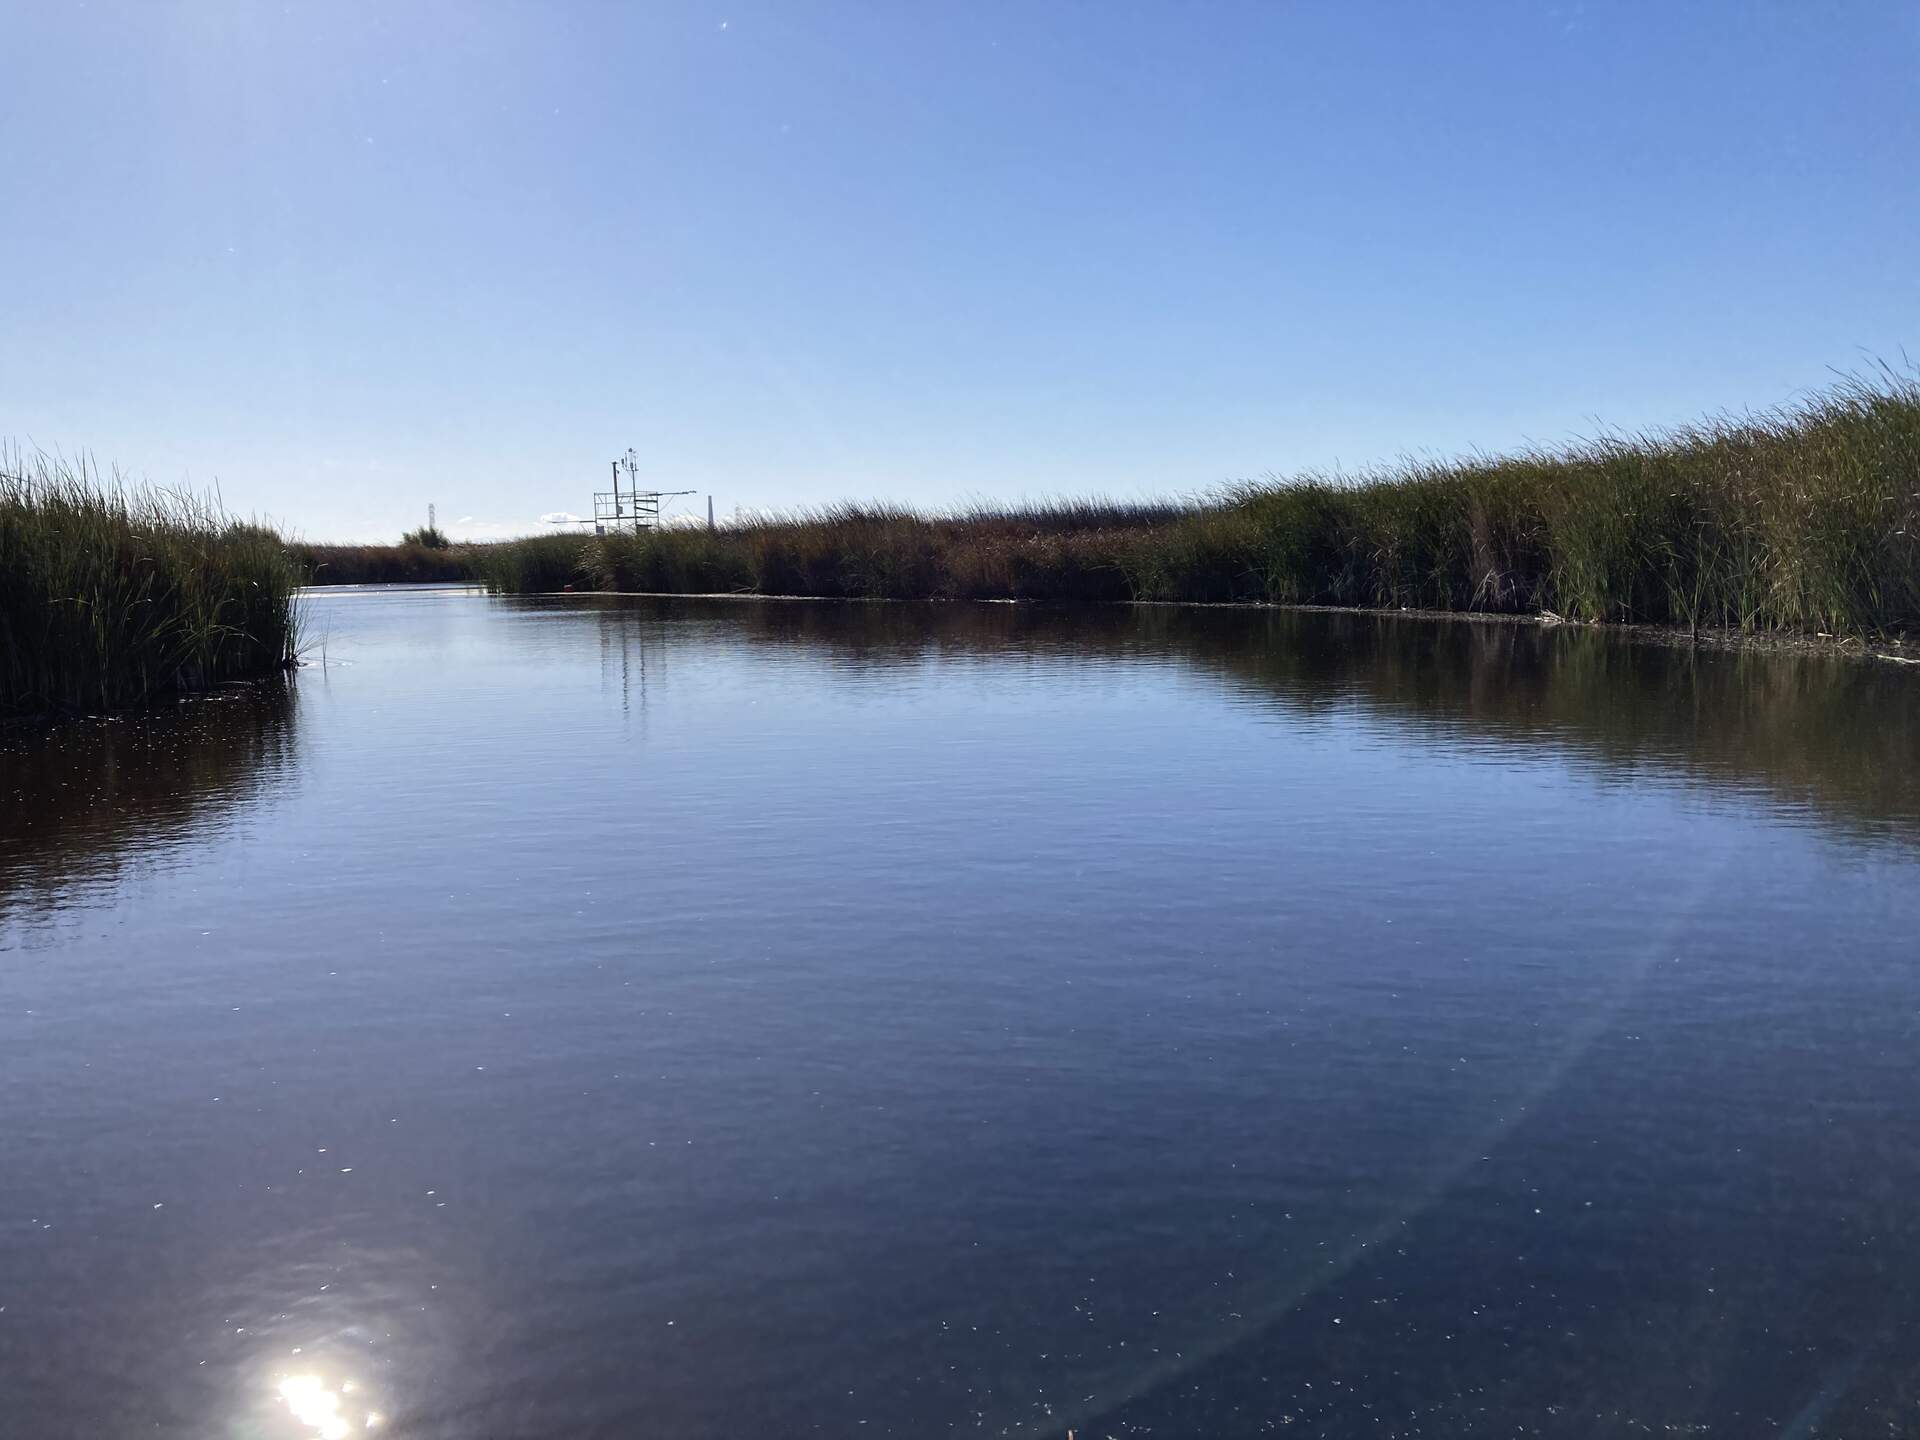
20231130MB_FallDayInTheWater.jpg ( 2023-11-30 10:32:39 ) Full size: 1920x1440
Autumn morning finding sampling locations along the tules
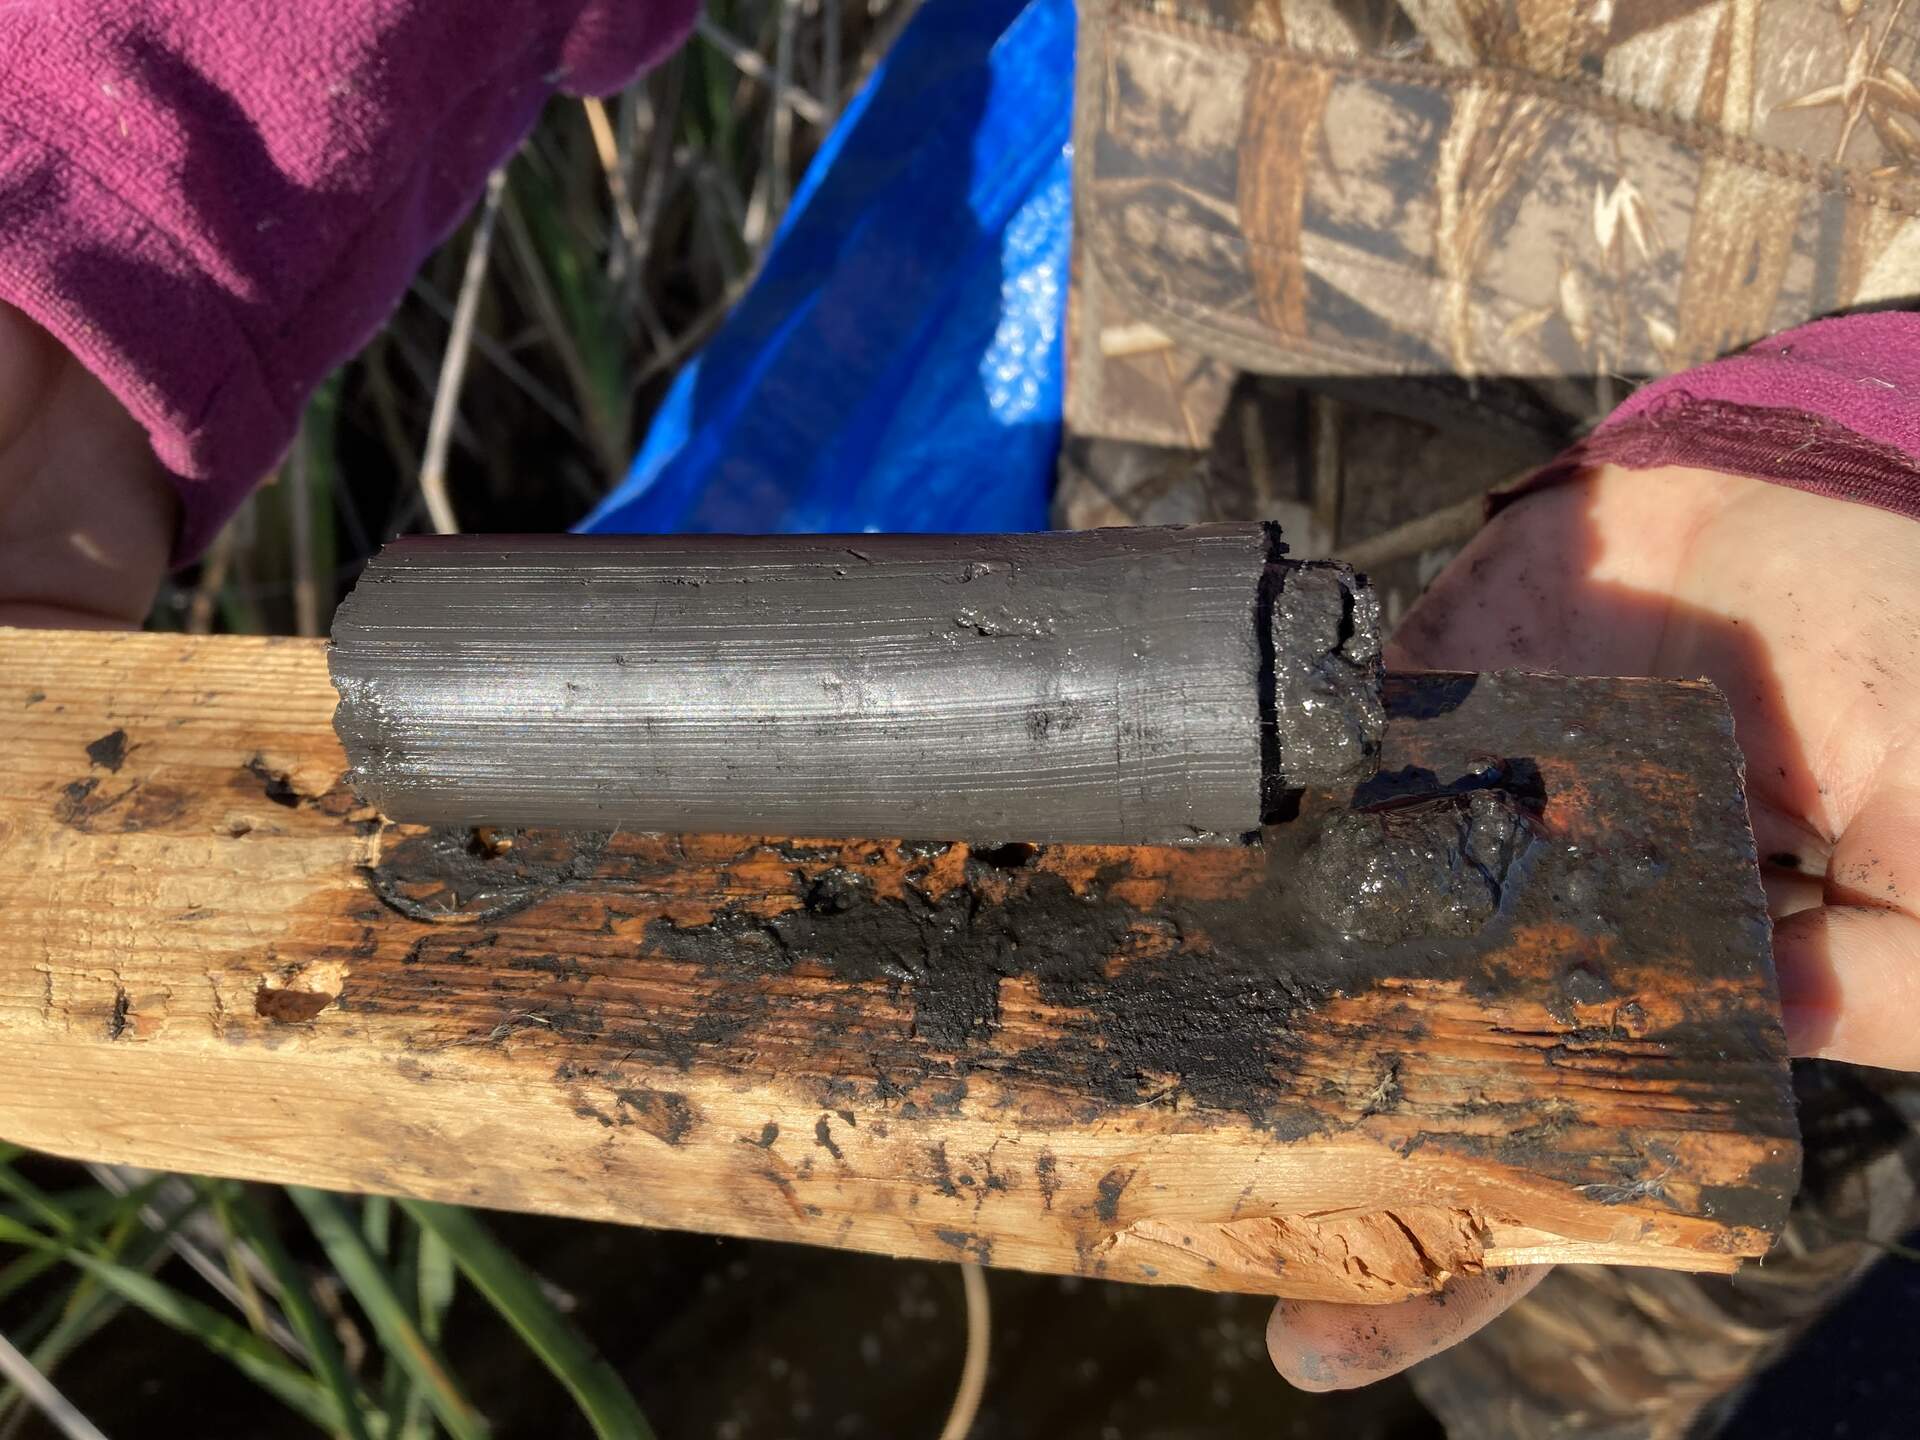
20231130MB_TestSoilCore.jpg ( 2023-11-30 10:22:16 ) Full size: 1920x1440
Test soil core from PCV pipe in ankle deep water
11 sets found
7 MB_flux graphs found
No data found for MB_met.
28 MB_tule graphs found
Can't check MBWPEESWGT_mixed
1 MB_cam graphs found
Can't check MBEEWPSWEPGT_cam
Can't check SIMBTWEE_met
1 MB_minidot graphs found
Can't check MBSWEEWPBCBA
1 MB_processed graphs found
Can't check MB_fd
1 MB_fd graphs found