Field Notes
<--2023-11-02 10:30:00 | 2023-11-30 12:30:00-->Other sites visited today: Tonzi
Phenocam link: Searching...
Vaira: 2023-11-13 11:00:00 (DOY 317)
Author: Joe Verfaillie
Others: Daphne
Summary: Standard data collection, things seem moist, cleaned up the bottom two staff gauges at the pond
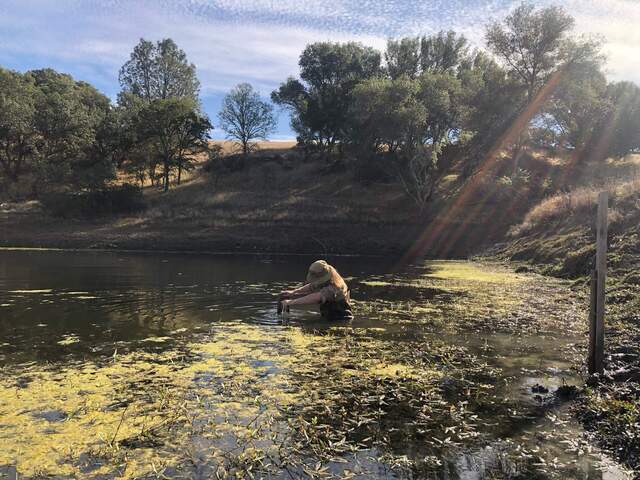
| Vaira 2023-11-13 Daphne and I arrived at about 11:00 PST. It was a mild and sunny fall day with some high thin clouds. Rain is coming later this week but they aren’t sure on amounts or timing. Things look moist here, not so crispy and green grass is more wide spread than last time. Daphne measured the well. I collected the flux, met, camera and FD data. All looked well. The 7500 read: 438.7ppm CO2, 362.1mmol/m3 H2O, 25.1C, 99.5kPa, 112.6SS SS is high, not sure why. We went to the pond. Last time I noticed that the lowest staff gauge seemed to be missing and the second lowest one had its bottom buried in mud. I dug out the bottom of the second one. After poking around in chest deep water near the first one I discovered that the staff gauge hadn’t fallen off but was just covered in muck making it nearly indistinguishable from the wooden post. I scrubbed off the top of the gauge. The water level was just below the top at 13.50ft We left at about 12:00 noon. |
Field Data
No tank data
Well Depth
| Date | Location | Depth (feet) |
|---|---|---|
| 2023-11-13 | VR_well | 60.12 |
| 2023-11-13 | VR_pond | 13.5 |
| 2023-11-13 | TZ_floor | 28.46 |
| 2023-11-13 | TZ_tower | 33.12 |
| 2023-11-13 | TZ_road | 37.2 |
No TZ Moisture Point data found
No VR Moisture Point data found
No TZ grass heigth found
No VR grass heigth found
No VR Tree DBH found
No water potential data found
No VR Grass Biomass data found
No VR OakLeaves Biomass data found
No VR PineNeedles Biomass data found
1 photos found

20231113VR_PondWork.jpg ( 2023-11-13 11:49:44 ) Full size: 1920x1440
Joe cleaning staff gauge
9 sets found
16 VR_met graphs found
2 VR_flux graphs found
No data found for VR_soilco2.
2 VR_pond graphs found
Can't check TZVR_mixed
3 VR_fd graphs found
4 VR_processed graphs found
4 VR_arable graphs found
6 VR_soilvue graphs found

