Field Notes
<--2023-11-13 12:10:00 | 2023-12-13 13:15:00-->Other sites visited today: Mayberry | Bouldin Corn | Vaira
Phenocam link: Searching...
Tonzi: 2023-11-30 13:10:00 (DOY 334)
Author: Joe Verfaillie
Others: Daphne
Summary: Standard fieldwork, zcam 1 dead due to water leak, collected pt den data and swapped batteries.
| Tonzi 2023-11-30 Daphne and I arrived at about 13:10 PST. Running a little late today with work done and to do in the Delta. It is mostly overcast with a breeze from the southeast. I don’t think there was recent rain but there is still a puddle in the road. The trees are mostly brown and yellow but still significant leaves. The grass is trying but it’s starting to get cold. It looks like a lot of thistles coming up near the tree trunks. Daphne worked on the soil moisture, well, and DBH measurements. I collected the data from the Tower top and the Floor. All seemed well. The Tower read: 427.7ppm CO2, 437.0mmol/m3 H2O, 14.3C, 98.9kPa, 100.8SS The Floor read: 430.7ppm CO2, 397.2mmol/m3 H2O, 16.5C, 99.0kPa, 101.0SS Daphne serviced the zcams. She discovered the Zcam 1 seemed to have a lot of condensation inside the box. The SD card and the camera lens were damp. The camera would not turn on so I removed it from its mount and discovered the screen was full of rusty water. I think it is dead. We brought it in. I added putty around the window and put some desiccant pack inside the try to dry things out. We need more of the orange-blue desiccant for the metal tins. And will need to reglue zcam 1 window – check others? I collected the point dendrometer data and swapped the batteries. I think all the battery voltages were above 5V so they probably could have gone longer. I put the one set of batteries that died fast last time (marked with red x’s) on tree 3 that seems to be dying. I collected the data just before and after 14:00 PST. The first two trees had 14:00 stamps in their files already so I though their clocks were a little fast. But the rest had 15:00 stamps in their files so I think the point dendrometer clocks are all one hour ahead (on PDT). They were installed at the beginning of November last year so probably during DST. I also remove the solar panel plug from box 1 and taped up the hole. I think I can use the spare solar panels from Arable to power these boxes. We left at about 15:00 PST |
Field Data
No tank data
Well Depth
| Date | Location | Depth (feet) |
|---|---|---|
| 2023-11-30 | VR_well | 60.36 |
| 2023-11-30 | TZ_floor | 28.88 |
| 2023-11-30 | TZ_tower | 33.62 |
| 2023-11-30 | TZ_road | 37.5 |
No TZ Moisture Point data found
No VR Moisture Point data found
No TZ grass heigth found
No VR grass heigth found
Tree DBH
| Date | Tag# | Reading (mm) |
|---|---|---|
| 2023-11-30 | 1 | 19.0 |
| 2023-11-30 | 102 | 5.9 |
| 2023-11-30 | 2 | 15.7 |
| 2023-11-30 | 245 | 8.5 |
| 2023-11-30 | 3 | 5.6 |
| 2023-11-30 | 4 | 7.8 |
| 2023-11-30 | 5 | 17.7 |
| 2023-11-30 | 6 | 6.9 |
| 2023-11-30 | 7 | 13.9 |
| 2023-11-30 | 72 | 5.7 |
| 2023-11-30 | 79 | 5.2 |
No water potential data found
No TZ Grass Biomass data found
No TZ OakLeaves Biomass data found
No TZ PineNeedles Biomass data found
1 photos found

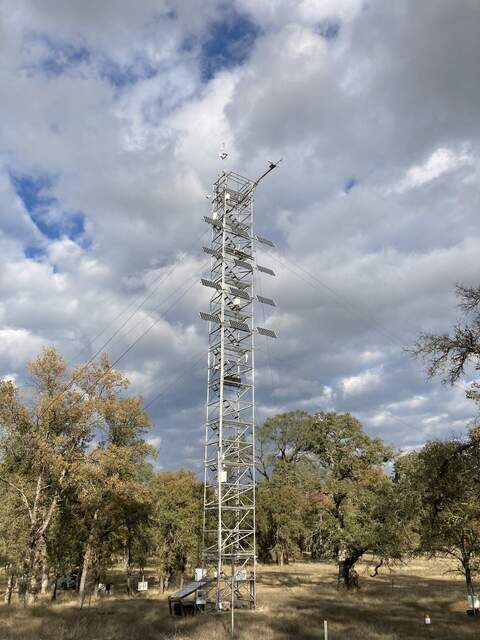
20231130TZ_Tower.jpg ( 2023-11-30 14:41:49 ) Full size: 1440x1920
Tower in late autumn afternoon
16 sets found
No data found for TZ_Fenergy.
11 TZ_tmet graphs found
No data found for TZ_soilco2.
Can't check TZ_mixed
3 TZ_mixed graphs found
1 TZ_fflux graphs found
8 TZ_fmet graphs found
No data found for TZ_tram.
3 TZ_co2prof graphs found
1 TZ_irt graphs found
No data found for TZ_windprof.
1 TZ_tflux graphs found
8 TZ_sm graphs found
Can't check TZ_met
1 TZ_met graphs found
Can't check TZVR_mixed
8 TZ_osu graphs found
3 TZ_fd graphs found
Tonzi Z-cam data

