Field Notes
<--2023-10-27 11:30:00 | 2023-11-20 16:25:00-->Other sites visited today: Bouldin Alfalfa | Bouldin Corn | East End | West Pond | Gilbert Tract | Hill Slough
Phenocam link: Searching...
Mayberry: 2023-11-06 12:20:00 (DOY 310)
Author: Daphne Szutu
Others: Joe
Summary: Regular data collection/cleaning, swapped RSB motor, low water level
| 2023-11-06 Mayberry Joe and I arrived at 12:20 PST. It was mild, humid, and breezy, mostly sunny with lots of fluffy cumulus clouds. There was some rain last night, and more significant rain is forecast for next week. We saw a few more sandhill cranes on the way in today. There was a Caltrans truck below Antioch Bridge. The water level is continuing to decline; the staff gauge read 25cm. We still need to order a replacement water level sensor for this site. Joe started with replacing the motor for the rotating shadow band. He swapped out the whole enclosure: the new enclosure has a new 2 RPM motor with a motor controller that brings the rotation down to about 0.5-1 RPM. The enclosure post was full of wasps that kept darting out at him. I downloaded met, cam, and USB GHG data. The 7550 box had an error after I pressed the eject button, but the data seem fine and there was no error when inserting the USB into the laptop. I changed the eddy clock +30sec to match the laptop clock, reset the box, and all looked ok. I downloaded the miniDOT data and swapped its desiccant. I also swapped the desiccant for the water level sensor before remembering we removed the sensor at the last site visit. I brought the water level sensor desiccant tube back. I put on new copper screens for the miniDOT and eosGP; the old screens had basically rotted clear away. Joe cleaned flux and rad sensors and reported lots of spiderwebs. He also put split loom on the wash tubing to prevent further opportunistic chewing. I took porewater conductivity measurements, but there’s so little water that I could only withdraw enough water at two depths. At the sippers, there was no water above the soil, so I took the “surface” measurement about 20cm away directly under the boardwalk, where there was 5-10cm of water. I had to lay the sensor down horizontally to get it fully submerged in the water. Depth, Temperature-compensated conductivity, Temperature Surface, 3.27mS, 19.2C Green, 10.51mS, 18.8C Yellow, 15.66mS, 20.4C Bare, no sample able to be collected Blue, no sample able to be collected Red, no sample able to be collected The 7500 read: 405ppm CO2, 644 mmol/m3 H2O, 22.7C, 100.8kPa, 102SS – 105 after cleaning The 7700 read: 1.98ppm CH4, 30RSSI – 68 after cleaning We left at 13:20 PST. |
1 photos found

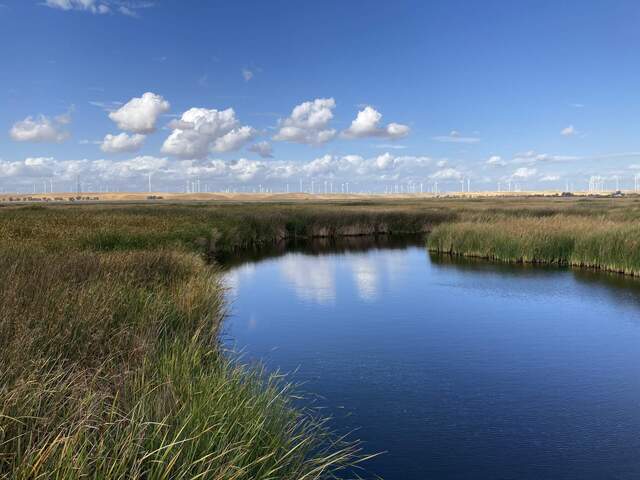
20231106MB_NiceDay.jpg ( 2023-11-06 12:51:21 ) Full size: 1920x1440
Nice autumn day at the site
11 sets found
7 MB_flux graphs found
No data found for MB_met.
28 MB_tule graphs found
Can't check MBWPEESWGT_mixed
1 MB_cam graphs found
Can't check MBEEWPSWEPGT_cam
Can't check SIMBTWEE_met
1 MB_minidot graphs found
Can't check MBSWEEWPBCBA
1 MB_processed graphs found
Can't check MB_fd
1 MB_fd graphs found

