Field Notes
<--2023-10-26 15:45:00 | 2023-11-20 09:40:00-->Other sites visited today: Bouldin Alfalfa | Bouldin Corn | East End | West Pond | Mayberry | Gilbert Tract
Phenocam link: Searching...
Hill Slough: 2023-11-06 16:50:00 (DOY 310)
Author: Daphne Szutu
Others: Joe
Summary: Regular data collection/cleaning, rad boom pin not working--fixed temporarily
| 2023-11-06 Hill Slough Joe and I arrived at 16:50 PST. This is our first site visit since Daylight Savings Time ended last weekend, so we got here just in time for sunset. It was near low tide and the channel was clearly visible. Joe used the telescoping scrubber pad to clean off the channel staff gauge. It read 3.65ft at 17:14 PST. I downloaded met, cam, and USB GHG data. Joe cleaned flux and rad sensors and reported many spiderwebs. He cleaned out some detritus from the precip bucket. The reservoir was ½ full; Joe refilled it. The pin on the rad boom is just long enough to connect the top and bottom square boom, but today the threads on the bottom boom had worn out enough that the pin could no longer secure both booms together. Joe fixed it temporarily and will prepare a longer bolt for next time. I measured the porewater and surface water conductivity. There was not enough surface water under the tower, so I measured the conductivity in the channel instead. Sample, Temperature-compensated conductivity, Sample temperature, Time Porewater, 8.33mS, 16.9C, 17:10 PST Surface, 6.34mS, 19.8C, 17:11 PST The 7500 read: 393ppm CO2, 617mmol/m3 H2O, 17.1C, 101.5kPa, 94SS – 101 after cleaning The 7700 read: 1.97ppm CO2, 36RSSI – 78 after cleaning We left at 17:15 PST. |
2 photos found

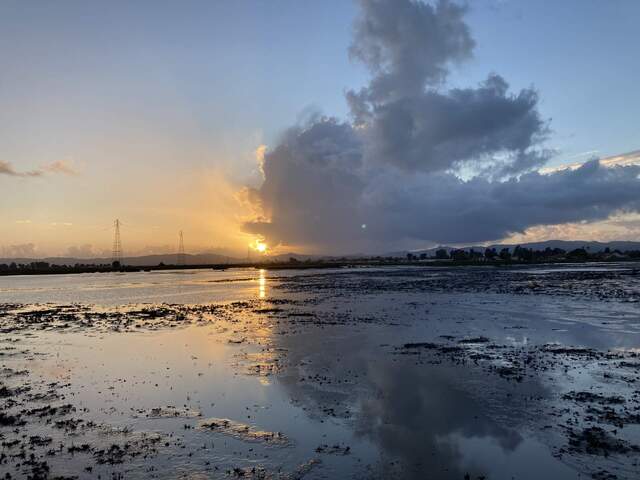
20231106HS_NiceSunset.jpg ( 2023-11-06 16:52:02 ) Full size: 1920x1440
Visiting the site on an autumn evening

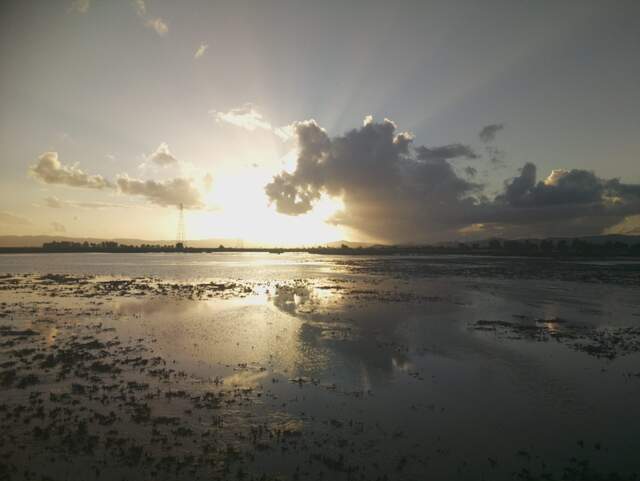
HS_picam_20231106_1645.jpg ( 2023-11-06 16:45:05 ) Full size: 1917x1440
Nice clouds at sunset
4 sets found
21 HS_met graphs found
4 HS_flux graphs found
1 HS_cam graphs found
Can't check HS_Processed
2 HS_Processed graphs found

