
Field Notes
<--2023-10-27 10:40:00 | 2023-11-28 10:00:00-->Other sites visited today: Bouldin Alfalfa | Bouldin Corn | East End | West Pond | Mayberry | Hill Slough
Phenocam link: Searching...
Gilbert Tract: 2023-11-06 10:00:00 (DOY 310)
Author: Daphne Szutu
Others: Joe, Sylvain, Patty, Patty, Eddie
Summary: Regular data collection/cleaning, Patty/Sylvain/Eddie visit the site, swapped 7500 for calibration, replaced upper boardwalk, cleaned ADCP, adjusted ADCP roll
| 2023-11-06 Gilbert Tract Joe, Sylvain, Patty, Patty’s student Eddie, and I arrived at 10:00 PST. Today is the first field day after Daylight Savings Time ended this past weekend. Our data time finally matches our lived time. This is Sylvain, Patty, Eddie’s first time at the site. Patty is planning to take over this site in a few years so she wanted to see the site. Eddie just started with Patty this semester and will be working on CO2 and H2O partitioning at Eden Landing. There was a bit of rain last night, and the weather was strangely mild and humid with lots of fluffy cumulus clouds. More significant rain is forecast for next week. Joe working on replacing the wood in the upper boardwalk while I showed the tower and the pond boardwalk to the visitors. The staff gauge read 72.5cm at 10:53 PST. I downloaded met, cam, and USB GHG data. Patty showed Sylvain how to clean the rad and flux sensors. The reservoir was ¾ full; we refilled it. I cleaned out the precip bucket—not too dirty. I downloaded the miniDOT data and swapped its desiccant. We swapped the 7500 for calibration: sn 75H-2669 came off and sn 75H-2176 went on. I uploaded the new config file, updated the pressure coefficients, changed the eddy clock +30sec to match the laptop clock, and rest the 7550 box. All looked ok. We will send sn 75H-2176 back to Licor along with the box we removed last time, sn AIU-1866. The head should be ok, but Licor thinks maybe the head messed up the box. Joe tested out his floating chamber—it floats! Patty is also working on building her own floating chamber. I measured the surface water conductivity near the CTD sensor off of the boardwalk. Sample, Temperature-compensated conductivity, Sample temperature, Time Surface, 340uS, 14.8 degC, 11:00 PST 2669 dirty: 396ppm CO2, 722mmol/m3 H2O, 20.0C, 101.4kPa, 93SS 2669 clean: 414ppm CO2, 669mmol/m3 H2O, 19.7C, 101.6kPa, 101SS 2176 fresh: 423ppm CO2, 650mmol/m3 H2O, 23.3C (large jump—maybe the sun was shining on it), 101.7kPa, 100SS The 7700 read 1.98ppm CH4, 63RSSI – 81 after cleaning We all drove down to the channel. I downloaded the ADCP data, reset its clock, and restarted data logging. Joe pulled up the ADCP to show to our visitors and cleaned off all of the muck. I will add “clean ADCP” to our to-do list every 4 months. The roll was -5.10 degrees and he adjusted it “just a little bit” so it’s now about 1.8 degrees. Allowed roll is +/- 5 degrees. We left around 11:30 PST. Patty, Sylvain, and Eddie headed home; Joe and I continued on to the other Delta sites. Looking at the data in the lab, eosGP might be misbehaving. Both CO2 and temperature data had step changes on 2023-11-02. See if we have a spare to prep for next time. |
1 photos found
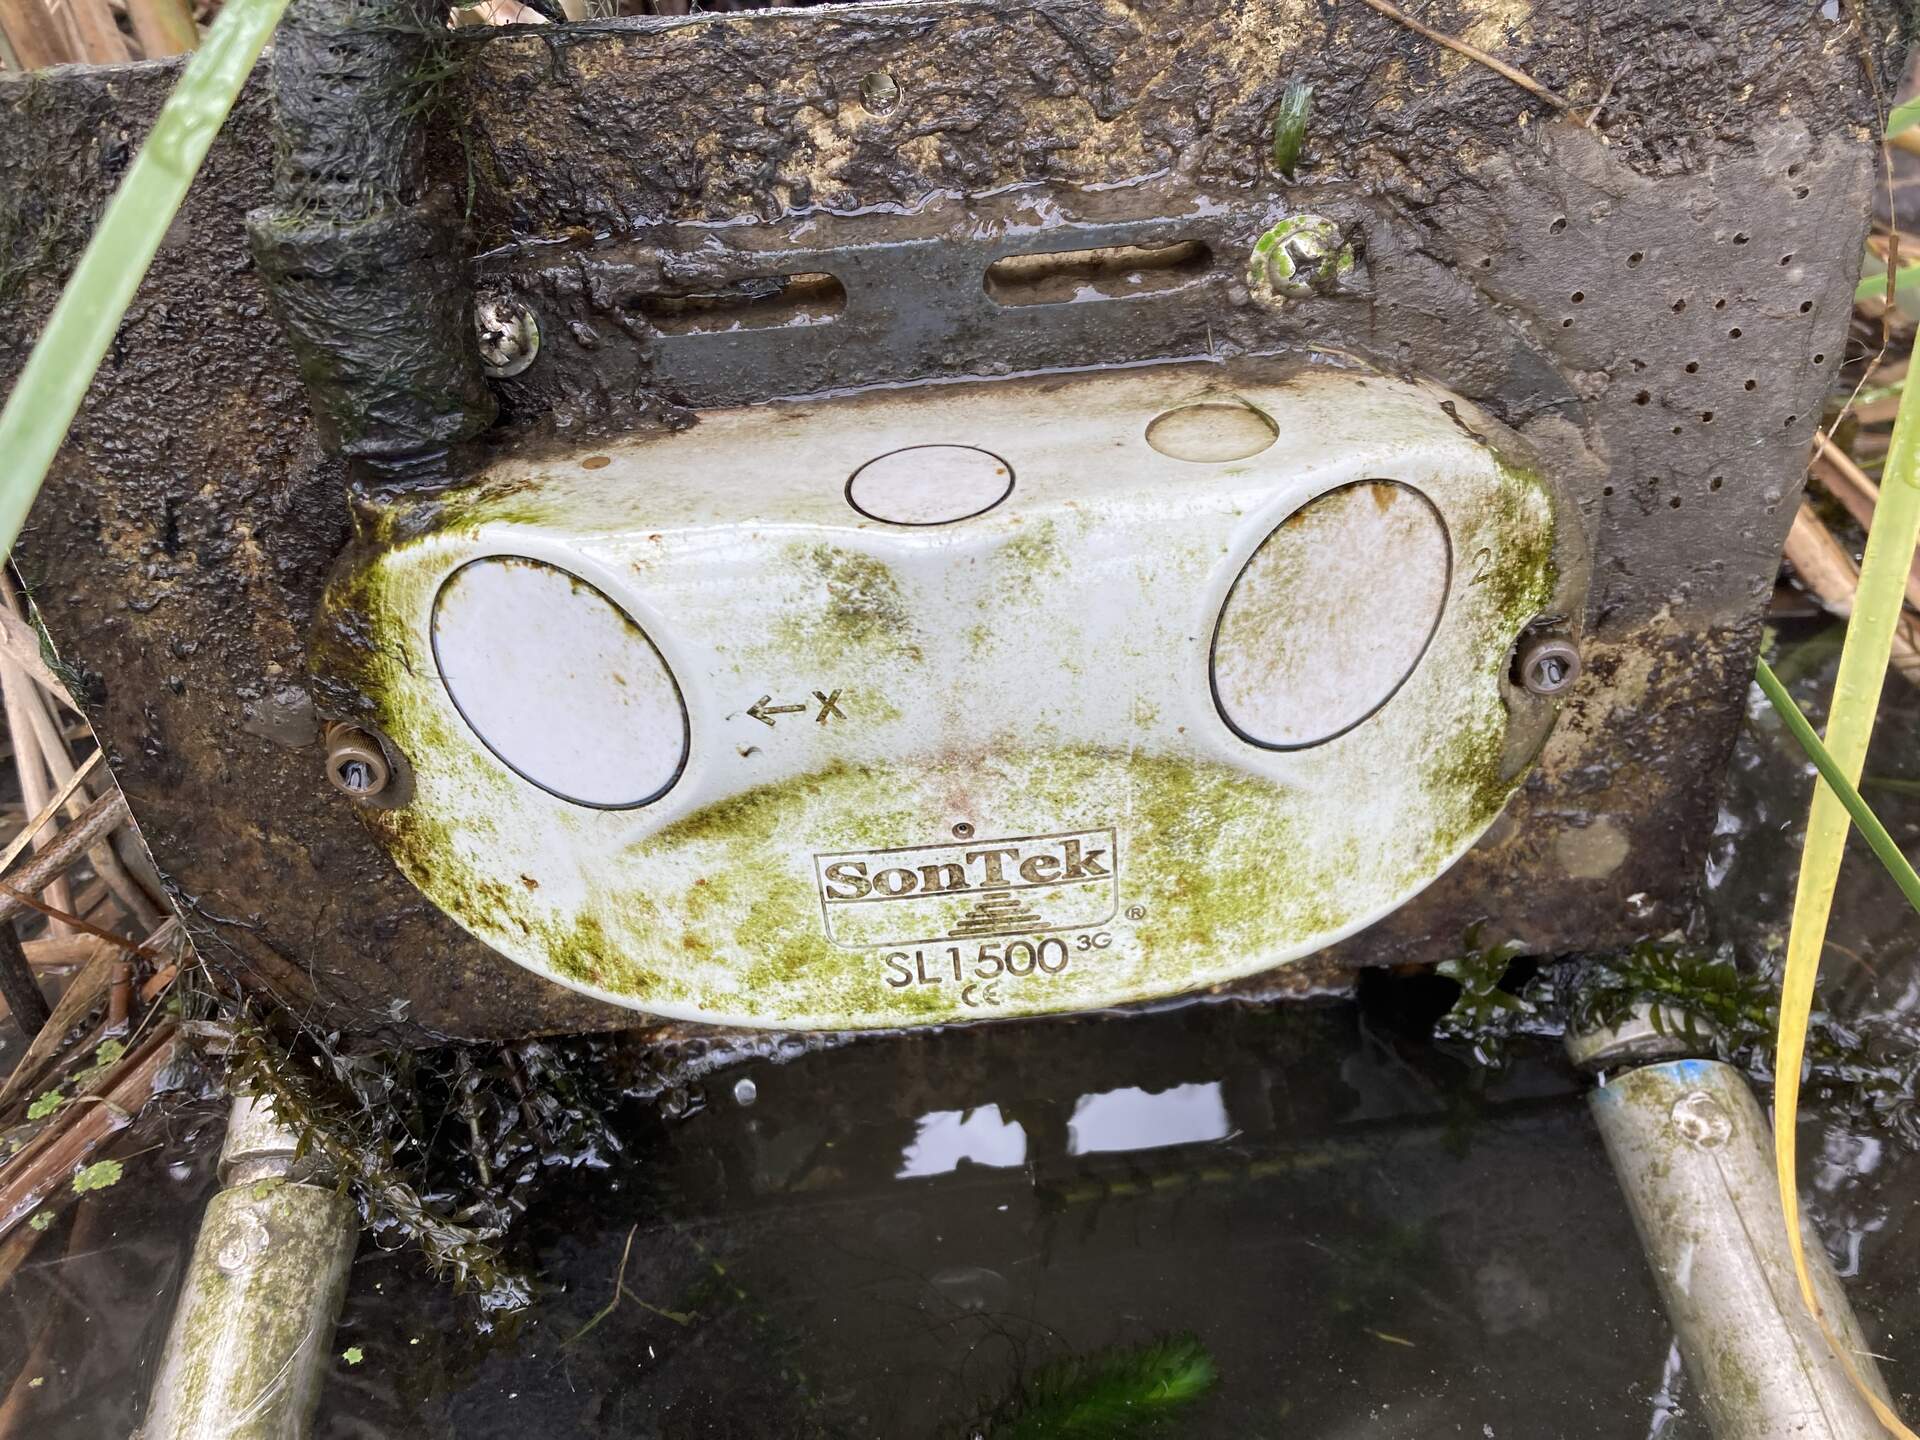
20231106GT_CleanedTheADCP.jpg ( 2023-11-06 11:09:26 ) Full size: 1920x1440
We scrubbed the muck off the ADCP
8 sets found
Can't check MBWPEESWGT_mixed
Can't check MBEEWPSWEPGT_cam
16 GT_met graphs found
4 GT_flux graphs found
3 GT_adcp graphs found
1 GT_cam graphs found
2 GT_usgs graphs found
No data found for GT_chanexo.