
Field Notes
<--2023-06-14 16:30:00 | 2023-06-29 09:00:00-->Other sites visited today: West Pond | East End | Mayberry | Gilbert Tract
Phenocam link: Searching...
Hill Slough: 2023-06-15 09:15:00 (DOY 166)
Author: Daphne Szutu
Others: Robert
Summary: Windy, attempted 7700 calibration but only set zero point
| 2023-06-15 Hill Slough Robert and I arrived at 9:15 PDT. Joe and I were here yesterday at the end of the day for the 7700 calibration, but it was too windy so we decided to stop here again this morning. However, it will still rather windy this morning. It was near low tide when we arrived but seemed to be coming up slowly. The staff gauge read 3.55ft at 9:10 PST as we were leaving. I collected the data yesterday so today was just about the calibration. Robert cleaned the 7700 and we started the calibration. I did the “zero” when it seemed to stabilize close to 0 ppm (offset of -0.003 ppm). However, the “span” point didn’t stabilize on a single number. The “stable” number would change by >0.25ppm so I decided not to span the sensor. I’ll keep an eye on the wind forecast to see what a good day would be to do the calibration. The other 7700 calibrations we’ve don’t his round have had small offsets, so I’m not worried about huge sensor drift. We replaced the spiky hat and water nozzle afterwards. The 7500 read: 414ppm CO2, 580mmol/m3 H2O, 16.8C, 101.4kPa, 99SS The 7700 read: 1.98ppm CH4, 31RSSI – 73 after cleaning We left at 10:15 PDT. |
1 photos found
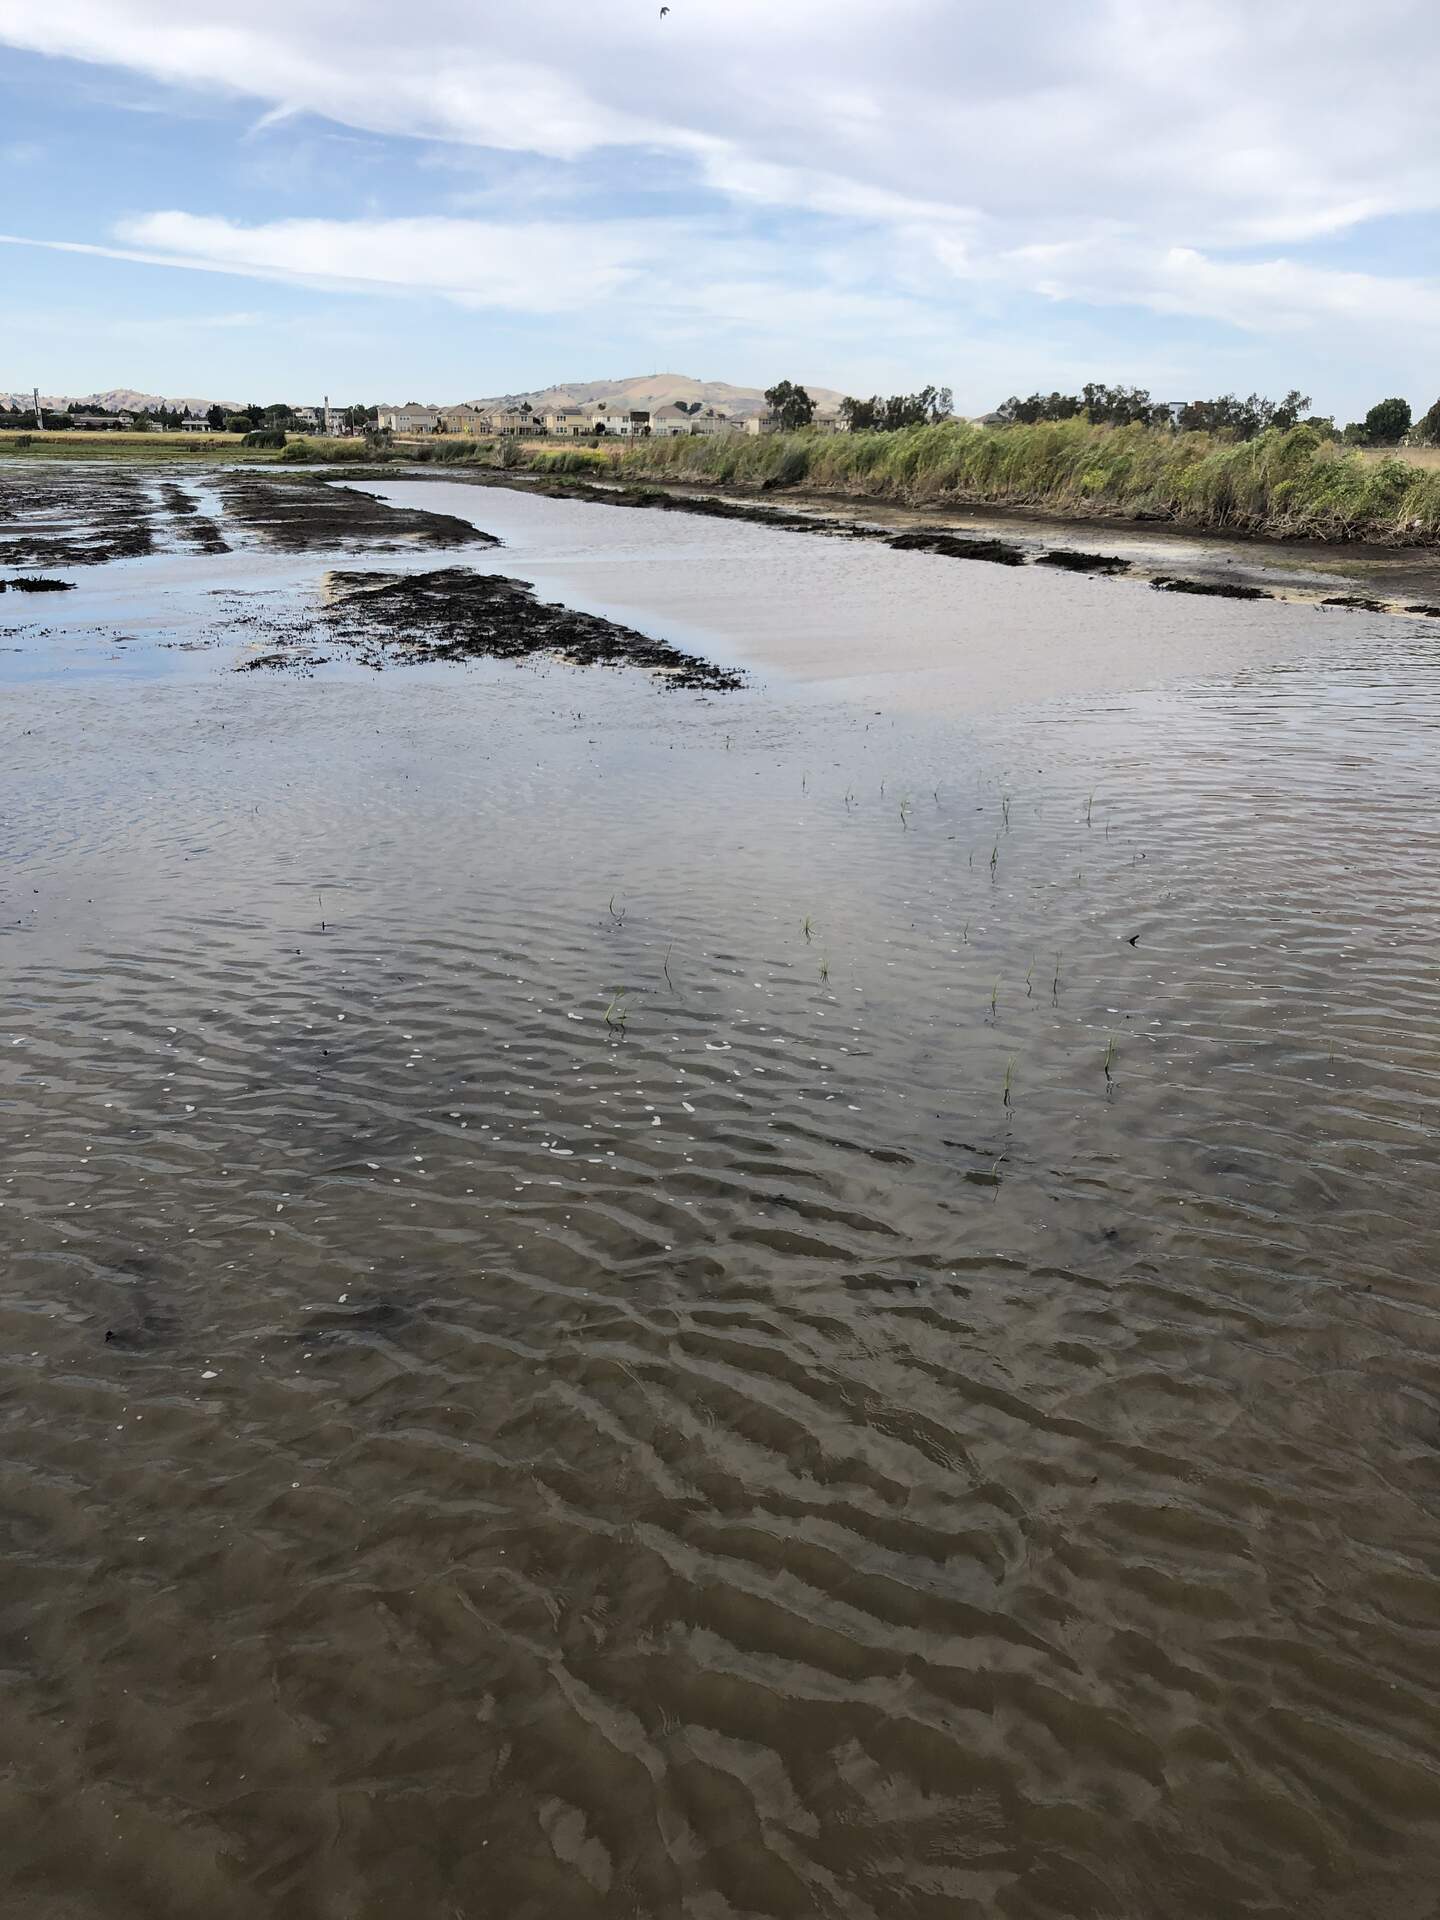
20230614HS_EmergentVegetation.jpg ( 2023-06-14 17:41:42 ) Full size: 1440x1920
A few small reeds emerging from the water. Maybe cattail?
4 sets found
20 HS_met graphs found
4 HS_flux graphs found
1 HS_cam graphs found
Can't check HS_Processed
2 HS_Processed graphs found