Field Notes
<--2010-10-27 09:30:00 | 2010-11-17 10:00:00-->Other sites visited today: Mayberry | Twitchell Rice
Phenocam link: Searching...
Sherman Island: 2010-11-05 09:30:00 (DOY 309)
Author: Joe Verfaillie
Others: Jaclyn
Summary: Bird on tower, bugs in box, otherwise okay.
| Sherman
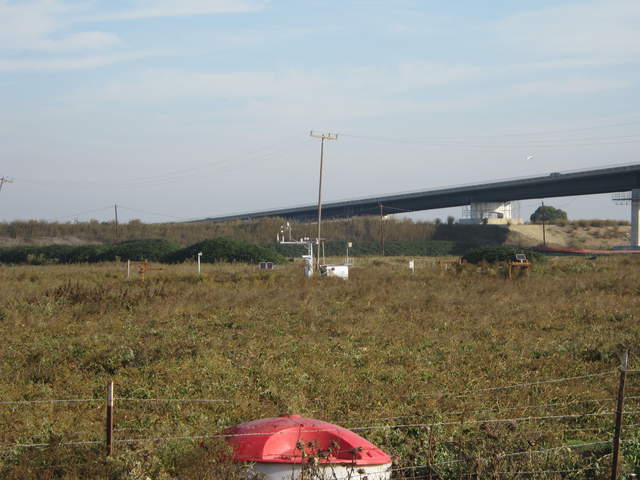
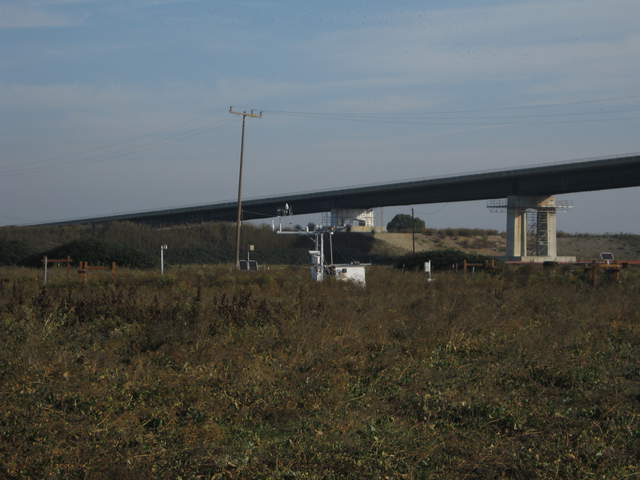
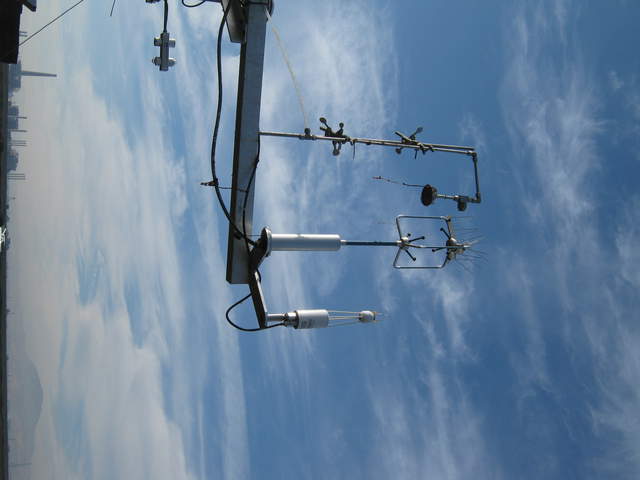
11/5/2010 I arrived about 9:30 with Jaclyn. It was cool and breezy from the southwest with a few high thin clouds. The field looked brown for the bridge. There was a bird of prey sitting on the intake tubing for the LGR, probably some kind of kite. Also there were some leftovers hanging off the intake and tower. This was just a quick check to make sure the tower was running. All seemed okay. Soil heat flux plate #2 was reporting –inf and the theta probes were reporting -2 or -3 which seemd strange to me, but I need to look at the data. There were some ants and spiders in the met data logger box. Maybe and a hole was left when the water pressure probe was removed last time. Data not collected |
4 photos found

20101105SI_BirdOnTower1.jpg ( 2010-11-05 09:52:17 ) Full size: 3648x2736
Bird on eddy sensors

20101105SI_BirdOnTower2.jpg ( 2010-11-05 09:53:05 ) Full size: 3648x2736
Bird on eddy sensors

20101105SI_EntrailsOnTower.jpg ( 2010-11-05 10:01:15 ) Full size: 3648x2736
Entrails hanging off of the closed path inlet

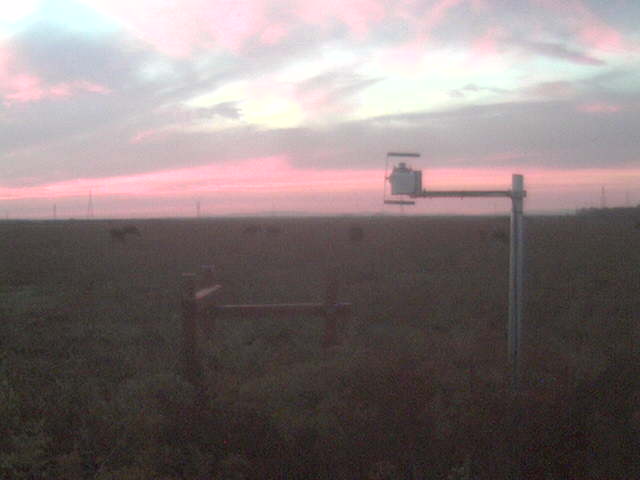
SI_webcam_20103081715.jpg ( 2010-11-04 17:15:02 ) Full size: 640x480
Nice colors in the clouds.
7 sets found
1 SI_mp graphs found
11 SI_met graphs found
Can't check SI_mixed
2 SI_mixed graphs found
5 SI_flx graphs found
2 SI_soilco2 graphs found
Can't check TWSI_mixed
Can't check SIMBTWEE_met

