Field Notes
<--2023-01-06 09:30:00 | 2023-02-01 16:00:00-->Other sites visited today: Gilbert Tract | Bouldin Corn | Bouldin Alfalfa
Phenocam link: Searching...
Hill Slough: 2023-01-19 15:55:00 (DOY 19)
Author: Daphne Szutu
Others: Kyle
Summary: Regular data collection/cleaning, cold, swapped DC-DC converter for channel sensors, HYDROS21 conductivity -9999--power cycled and maybe fixed
| 2023-01-19 Hill Slough Kyle and I arrived at 15:55 PST. It was cold, partly overcast, and breezy but not as windy as it could be. The water level seemed pretty high for being near low tide (~8pm tonight). The staff gauge read 5.50ft at 16:17 PST. I downloaded met, cam, and USB GHG data. There have been a few ~1-day outages in the past 2 weeks because of low power. The reservoir was 1/4 empty; Kyle refilled it. Kyle also cleaned flux and rad sensors. I collected a porewater sample from the sipper to take back to the lab and measure for conductivity later. Sample, temperature-compensated conductivity, temperature, notes Porewater, 18.36 mS,, Sample stored in fridge before being measured I checked the dfPAR enclosure because some enclosures have had water pooled at the bottom with the recent rain. This enclosure was surprisingly dry. I noticed that the hole where the proximity sensor wire enters the box is sealed with putty. The HYDROS21 data looked weird with -9999 conductivity values, so we stopped at the channel CR23X to take a look. I swapped the DC-DC converter that steps down the 12V+ solar panel to the 12V lithium power pack. The old converter had slightly loose connections from soldering them in the field last week. The new converter has solid connections. I power cycled the HYDROS21 and it had reasonable numbers, so I left it as is. The 7500 read: 421ppm CO2, 270mmol/m3 H2O (seems low), 13.5C, 102.4kPa, 100SS -- did not clean The 7700 read: 1.97ppm CH4, 48RSSI – 72RSSI after cleaning We left at 16:40 PST. |
1 photos found

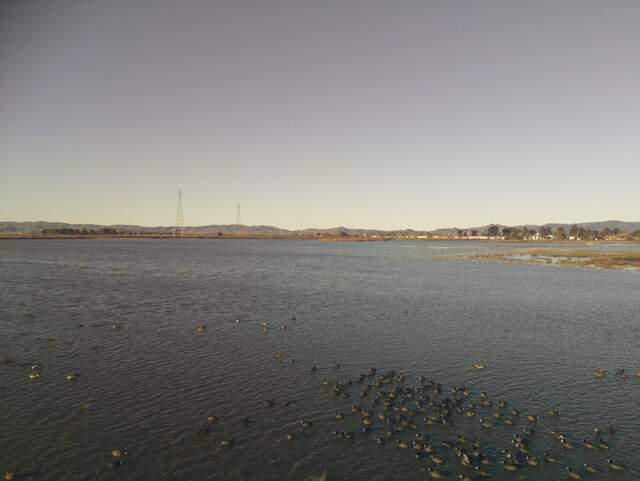
HS_picam_20230120_0845.jpg ( 2023-01-20 08:45:05 ) Full size: 1917x1440
Lots of coots on the water
4 sets found
20 HS_met graphs found
4 HS_flux graphs found
1 HS_cam graphs found
Can't check HS_Processed
2 HS_Processed graphs found

