
Field Notes
<--2023-01-03 09:55:00 | 2023-01-25 17:15:00-->Other sites visited today: Bouldin Corn | Bouldin Alfalfa | Hill Slough
Phenocam link: Searching...
Gilbert Tract: 2023-01-19 08:45:00 (DOY 19)
Author: Daphne Szutu
Others: Kyle
Summary: Regular data collection/cleaning, high water level at the tower, cold and breezy, calibrate 7700, swapped 7500 for calibration, phenocam clock offset--reset, meant to retrieve EXO but water level too high, dfPAR not working--probably needs new motor
| 2023-01-19 Gilbert Tract Kyle and I arrived at the Gilbert Tract channel around 8:45 PST. It was overcast, cold, and breezy. The water at the channel was brown and flowing quickly into the wetland. One of our goals today was to retrieve the UCSC EXO from the channel because (1) UCSC has requested their EXO back, and (2) the USGS EXO will be deployed next week (their EXO is fresh from factory repair for its internal power bank). We started at the channel because low tide was around 7:30 this morning. However, the water level was already too high to reach the EXO post safely, so we couldn't retrieve it today. I'll come back next week to get it before USGS deploys theirs. We downloaded the flowmeter data, reset its clock, and restarted data logging. There were a lot of drops in depth data the past 2 weeks, but the water level was too high to see how much plant cover was near the sensor. I waded down along the railing with the telescoping rake but even then I couldn't reach below the sensor. We pulled up the sensor and it looked fine. We pushed the sensor back down and secured it in the same position as before. I raked up some water hyacinth from the water surface with the rake. We got to the main tower around 9:05 PST. The upper boardwalk had been removed at the beginning of the month for storm prep, so we installed it again. The water under the tower was about halfway up our boots and the tide was still coming in. The staff gauge was submerged when we arrived, so no staff gauge reading today. Kyle and I carried the 7700 cal gas tanks to the foot of the tower. We set them down on the ground in about 20cm of water. Kyle cleaned the rad and flux sensors and we started the 7700 calibration. Optics RH was 24%, so I planned to flush the headspace with zero air after the calibration. However, the tubing was just barely short so I did not flush it, just swapped the desiccant. The tubing probably would have reached it if the gas tanks were directly underneath the sensor, but we had placed them slightly closer to the road since the water was more shallow on the upland side of the tower. I didn't want to relocate the gas tank today because the water level was still rising and I wanted to leave before the water level overtopped our boots. I downloaded met, cam, and USB GHG. We refilled the wash reservoir (no notes about how full it was but I don't think it was completely empty). Kyle and I cleaned flux and rad sensors. The shadowband was not rotating and did not start when I tried to manually turn it. I opened the enclosure and there was about 1/2cm of water on the bottom. Probably need a new motor here. We swapped the LI-7500A for calibration: sn 75H-2418 came off and sn 75H-2667 went on. I uploaded the new config file, updated the pressure coefficients, changed the eddy clock +45sec to match the laptop time, and reset the 7550 box after the 7700 calibration finished. All looked ok. The camera clock has been offset since early January. I changed it from 2000-01-12 ~7:00 to 2023-01-19 10:40 to match the laptop time. The camera's time zone is in UTC-7 because for some reason putting in UTC-8 makes the clock off by an hour. I noticed the sensor extension box out on the boardwalk had slid down to its original height despite the zip-tie. I raised it again to make sure it wouldn't get wet during the upcoming king tides, tightened the zip tie, and added two more zipties for good measure. Maybe a hose clamp would be more secure next time. The first three lengths of boardwalks were wobbly and in various states of submersion. The last length of the boardwalk was fully submerged but sturdy. 2418 dirty read: 418ppm CO2, 415mmol/m3 H2O, 7.0C, 102.4kPa, 97SS 2418 clean read: 424ppm CO2, 404mmol/m3 H2O, 7.1C, 102.4kPa, 99SS 2667 fresh read: 428ppm CO2, 393mmol/m3 H2O, 8.0C, 102.3kPa, 10SS The 7700 read: 3.0ppm CH4, 2RSSI (RSSI very low) The 7700 after cleaning read: 2.0ppm CH4, 86RSSI We left at 11:15 PST, stepping on the cinder blocks to keep the water from flowing into our boots. The higher water level actually made it slightly easier for one person to heft the cal gas tanks to higher ground where we could both pick it up while keeping our feet dry. |
4 photos found

20230119GT_FloodedBoardwalk.jpg ( 2023-01-19 11:11:29 ) Full size: 1440x1920
Water level is so high can't even tell the boardwalk is there; only the top of the black plastic pipes are visible
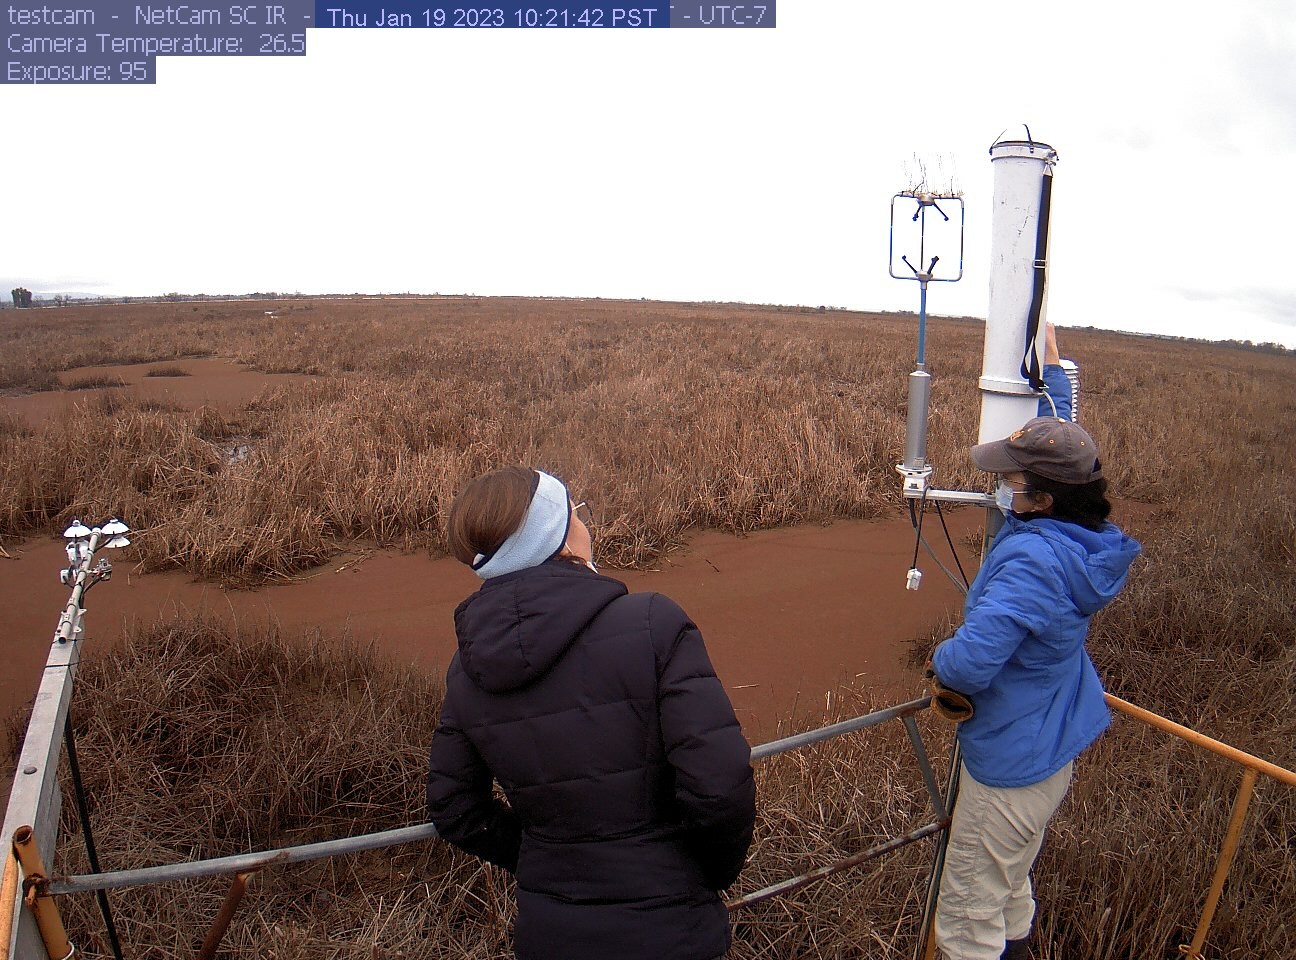
gilberttract_2023_01_19_102142.jpg ( 2023-01-19 18:21:42 ) Full size: 1296x960
Kyle and Daphne calibrating 7700

gilberttract_2023_01_19_104405.jpg ( 2023-01-19 18:45:12 ) Full size: 1296x960
Calibrating LI7700
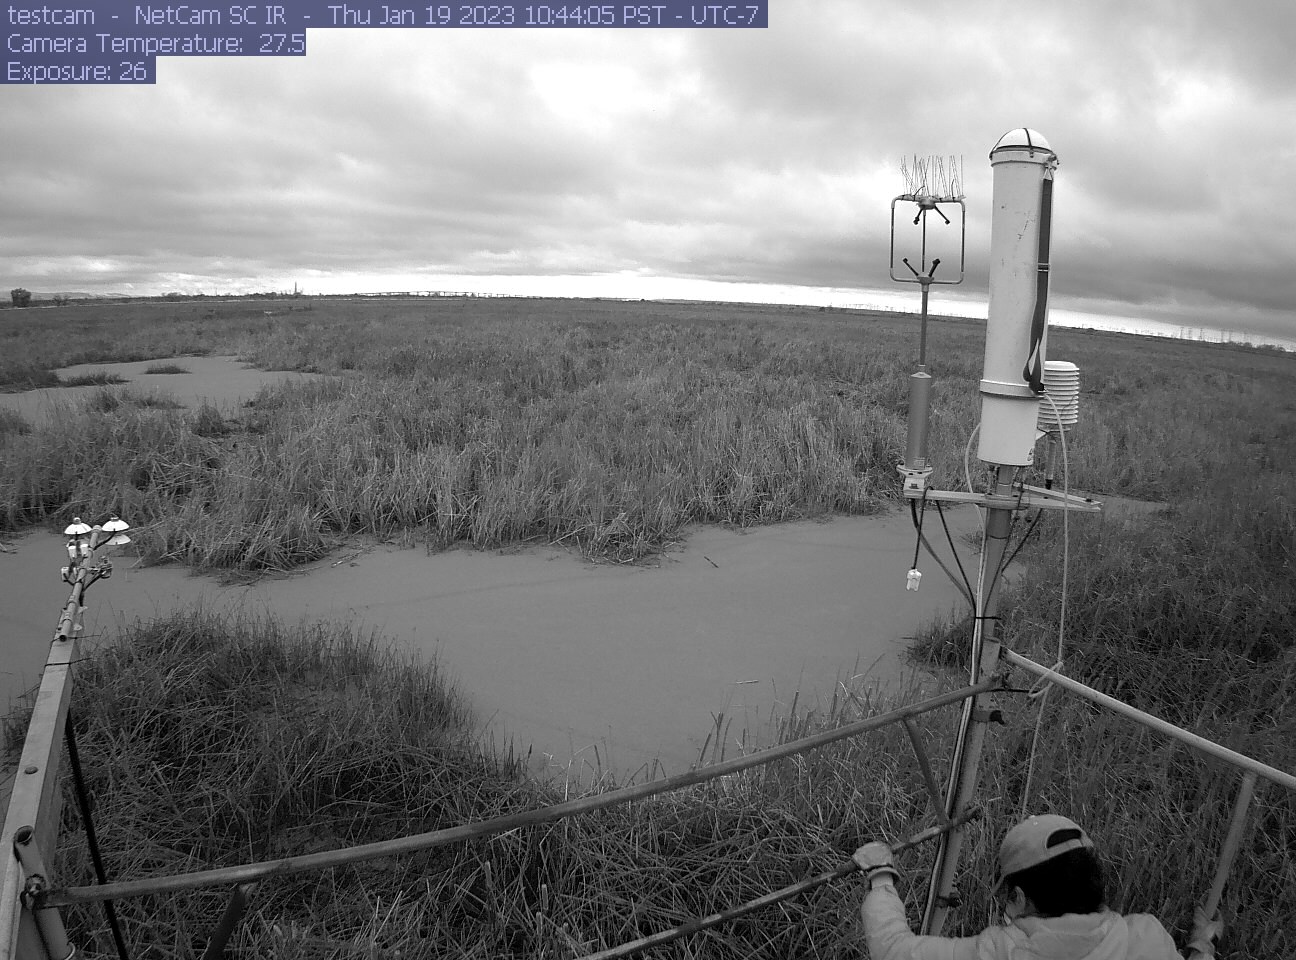
gilberttract_IR_2023_01_19_104405.jpg ( 2023-01-19 18:45:58 ) Full size: 1296x960
Daphne on site in near IR
8 sets found
Can't check MBWPEESWGT_mixed
Can't check MBEEWPSWEPGT_cam
16 GT_met graphs found
4 GT_flux graphs found
3 GT_adcp graphs found
1 GT_cam graphs found
2 GT_usgs graphs found
2 GT_chanexo graphs found